Boot IO Analysis with uberAgent for Splunk 1.5
- Logs & Metrics, UberAgent
- Published Aug 16, 2013 Updated Feb 23, 2021
Analyzing slow boots is a difficult task. You need to install software like XPerf and master its far-from-intuitive command-line options to generate a trace file that you can then analyze. Once you find a possible cause for the long startup duration you never know if it is specific to the machine you analyzed or if it affects other PCs, too. In other words: XPerf, although powerful, is difficult to master. And it does not scale. uberAgent does. And it is super-easy to use.
Boot IO
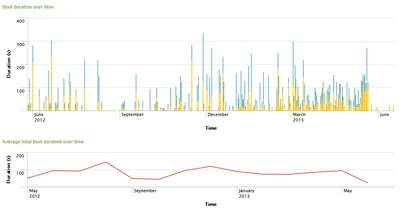
uberAgent for Splunk 1.5 not only shows you in great detail the duration of the various boot phases:

It also tells you why the HDD LED is flickering like crazy while the system is booting. As we know, in many cases slow boots are caused by too many IOs. The following screenshot shows a system boot initiated by Windows Update:
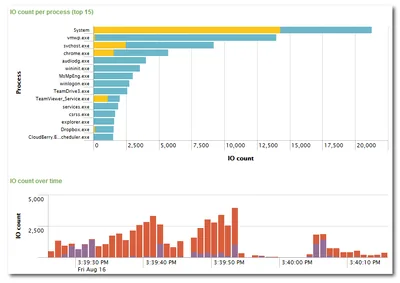
In the upper of the two graphs reads are blue and writes are yellow. It is easy to see why Windows Update incurs such a performance hit: System generates nearly 15,000 writes. Comparing that to another boot without any pending updates:
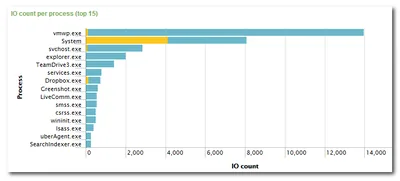
Here, the number of writes by System is just above 4,000. This tells us that Windows update added around 10,000 IOs to the boot process. Now imagine a poor magnetic hard drive with around 100 IOs per second…
True IOPS per Application … or per Session
Earlier versions of uberAgent measured IO at the application level. As this does not take the effect of the file system cache and other optimizations into account the numbers were much too high. As of version 1.5 uberAgent gives you the raw IOs as they are passed from the OS to the disk. This is much more realistic. Of course, this kind of data is available per process, application, user session, and even browser site.
Per-User Network Throughput
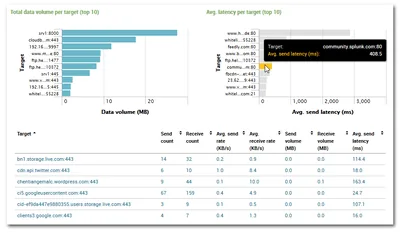
One of the many questions I was asked when presenting uberAgent was whether it could show the network bandwidth per user on a XenApp machine. Now it can! And not only per user (session), also per process, application or browser site. This makes it possible to analyze the impact users have on WAN links, but of course, it also shows you how (in-) efficient your applications are using the precious resource WAN bandwidth.
Multi-Tenancy
A single Splunk server can be used to process data from more than one customer and uberAgent now fully supports this (here is how to configure it). Administrators see everything, customers see only their own data. It is that simple.
What Else?
We have made many other improvements to uberAgent. For example, we managed to even further reduce its footprint. It is now so small that you will have a hard time noticing its presence on a system.
There is much more, of course. Go try it out yourself!




Comments