Analyzing a Slow Boot with Windows Performance Recorder & Analyzer
In the last five years Xperf has gained popularity as an administrator’s secret weapon for battling all kinds of performance issues. But just when it was on the brink of becoming as mainstream as such a tool can be, Microsoft superseded it by something else: Windows Performance Recorder.
To understand why we need to take a look at the recommended command line for capturing boot traces:
xbootmgr -trace boot -traceflags base+latency+dispatcher -stackwalk profile+cswitch+readythread -notraceflagsinfilename
Hmm, not very intuitive. It turns out Microsoft came to the same conclusion: obtaining traces with Xperf was, at times, very complex. Knowing which providers and stackwalking flags to enable was a struggle all together.
They are right, of course. Selecting the best options for each type of trace is a bit like Alchemy with Xperf. It makes a lot of sense to wrap that into a UI. They did and called it Windows Performance Recorder. It comes as part of the Windows Assessment and Deployment Kit (ADK) for Windows 8, but works on Windows 7 / Server 2008 R2, too. Just as with Xperf and Xperfview there is a separate component for analysing the traces called Windows Performance Analyzer.
The Problem
The problem I was trying to analyze was this: a customer was finding that a laptop, freshly installed with the corporate image, was taking 3.5 minutes to boot to a usable state (by that I mean from the time Windows starts until CPU and hard disk load have dropped so that the system can actually be put to use).
Creating the Trace
I reinstalled Windows on one of the corporate laptops, waited for the full disk encryption to finish and rebooted a few times to give Windows ReadyBoot enough time to do its optimization magic.
Then I prepared the system for WPR by running the following command:
wpr -disablepagingexecutive on
Do not forget to turn it back off when you are done as it can adversely affect performance.
Then I configured the boot trace options in Windows Performance Recorder (wprui.exe):
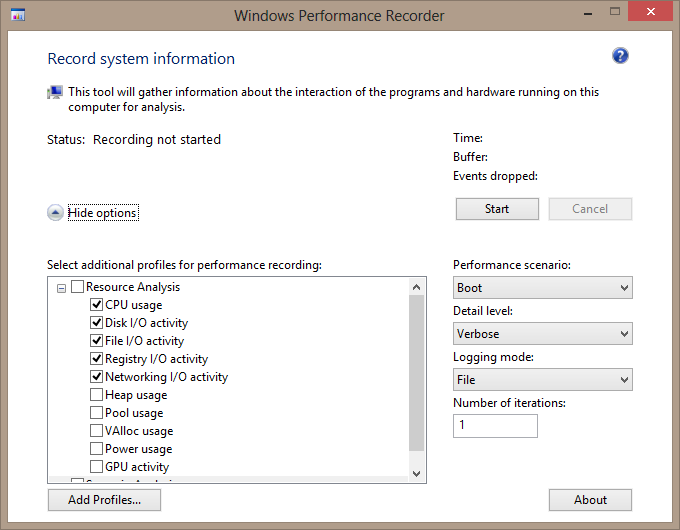
I rebooted to create the trace. Then I ran wprui.exe again to have it stop the trace and save the trace file, which took up a whopping 3 GB on the hard disk.
Analyzing the Trace
When I opened the trace file Windows Performance Analyzer (wpa.exe) displayed CPU, IO and memory loads as well as potential delays in these default graphs:
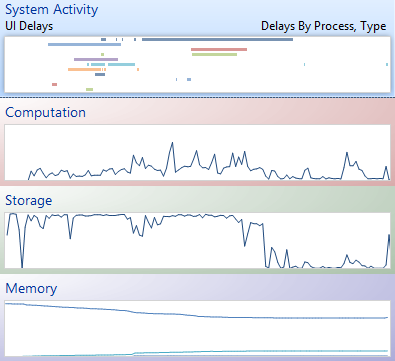
The storage graph looked most interesting. I took a closer look: by double-clicking the graph it was opened in the main window area:
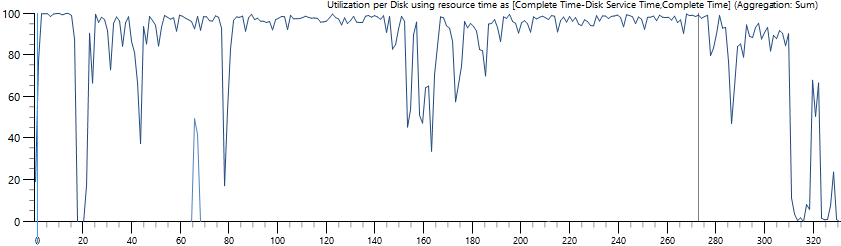
With the disk utilization nearly constantly at 100% it was evident that the hard drive was overloaded. That conclusion was easily confirmed by watching the hard disk LED: during the boot phase it was not flickering, but glowing brightly.
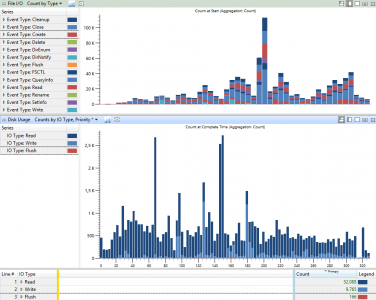
The obvious question was: what was generating all those IOs? To find out I expanded Storage and then Disk Usage, dragged Counts by Process, IO Type to the main window and got this:
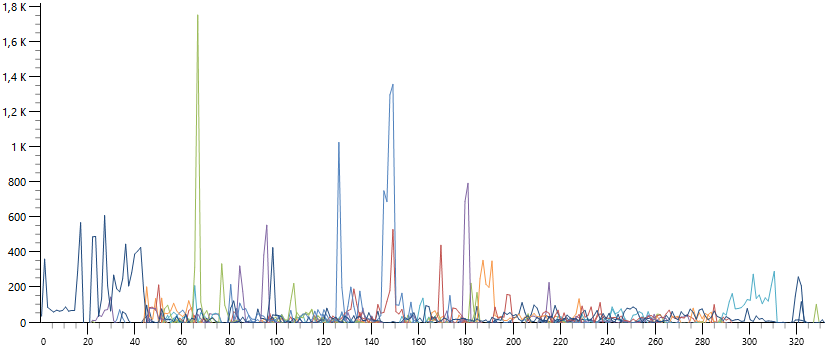
It was clear that many different processes contributed to the IO load (each line in the chart represents one process). To confirm this I switched the Disk Usage display mode from graph only to table only and sorted by IO count:
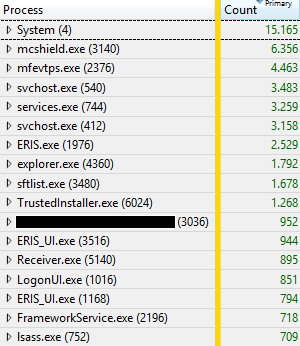
In addition to the system and other OS components we have:
- McAfee antivirus
- various Windows services (notably Offline Files)
- Matrix 42 Empirum (software distribution agent)
- App-V client
- Citrix Receiver
- a component written in-house by the customer
Hypothesis
My hypothesis was this: there was just too much going on for the poor magnetic hard drive. To test it, I replaced the laptop’s disk with an SSD (nothing special, just some boring 160 GB Intel model). Then I reinstalled the machine, performed the same preparatory steps as before and finally measured the boot time: it had dropped from 210 to 50 seconds.
Hypothesis confirmed.
Conclusion, and How to Monitor Boot Times
Windows Performance Recorder & Analyzer are powerful tools for analyzing performance problems. The complexity of creating traces has been reduced a lot compared to Xperf, but the really difficult thing still is the interpretation of the results, of course. If you know how to do that WPR/WPA give you great information about a single system.
Obviously, creating traces with WPR is something you only do when you already know boot time is bad. But how do you find out? Waiting for users to complain is probably not the best technique, you might want to be a bit more proactive.
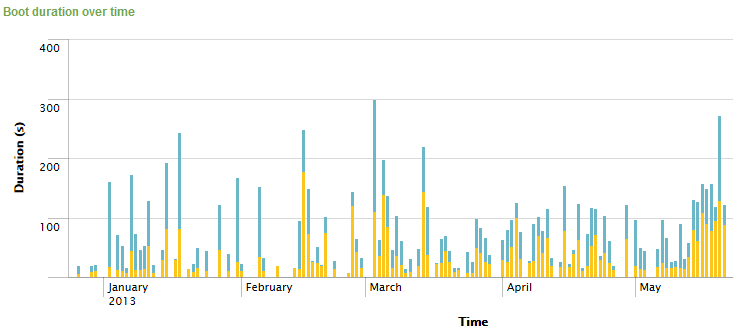
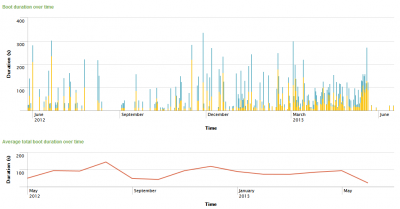
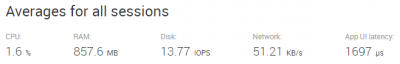
uberAgent for Splunk, our user experience monitoring tool, gives you everything you need to keep boot performance snappy. It reports on boot duration across all machines…
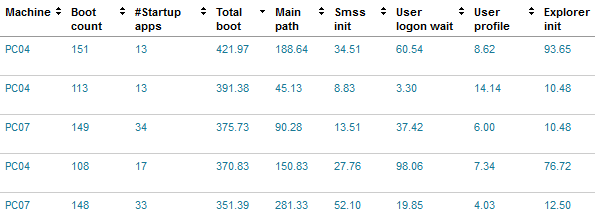
…identifies computers that boot slowly…
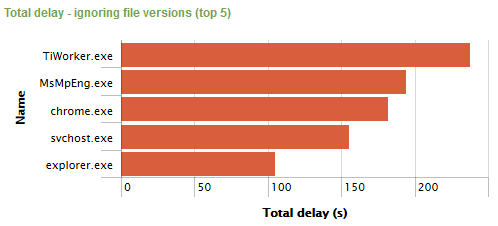
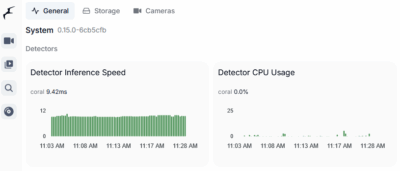
…and even gives you probable causes:


6 Comments
I don’t know if you’re still having this issue, but try setting the App-V client to not automatically refresh on login, you should save more time then.
A really nice article, but i did not understand what you meant by “dragged Counts by Process, IO Type to the main window and got this:”. where do you drag and what is the main window. sorry if i am trivial as i am new to this.
Right at the top there are some “filters” one could use to reorganize data by counts (or other outlooks) instead of a temporal outlook, it’s a drop-down menu that can also be activated by Ctrl+P once you double-click the storage graph on the left.
Interesting article but the conclusion seemed to be that using the MS WPR and analyzer is too difficult to use and boot faster by installing SSD. I guess I was looking for something I could use, as a normal human without a degree in MS to analyze my 9370’s slow boot time. This didn’t help me.
Very useful, thank you! I’ve been running my Win7 machine for 8 years (with various upgrades), but now I noticed significant a drop in boot performance in recent months. This has helped me identify some of the issue points.
It’s like saying, ‘My bicycle was slow, so I switched to a motorcycle and now the problem is solved,’ after replacing a slow HDD with a fast SSD to resolve an issue. HaHa !!!