What Is Splunk and How Does It Work?
- Logs & Metrics, UberAgent
- Published Sep 3, 2014 Updated Apr 19, 2025
You have probably heard of Splunk, but can you describe what it does to a colleague in a few sentences? That is not easy. Splunk does not belong in any traditional category but stands apart from the crowd. That makes it interesting, but also the explaining harder. Here is my attempt.
Google for Logfiles
What do you do when you need information about the state of a machine or software? You look at its log files. They tell you the state it is in and what happened recently. Great.
What do you do when you need information about the state of all devices in your data center? Looking at all log files would be the right answer if it was possible in any practical amount of time. This is where Splunk comes in.
Splunk started out as a kind of “Google for Logfiles”. It does a lot more today but log processing is still at the product’s core. It stores all your logs and provides very fast search capabilities roughly in the same way Google does for the internet.
Search Processing Language
Although you can just use simple search terms, e.g. a username, and see how often that turns up in a given time period Splunk’s Search Processing Language (SPL) offers a lot more. SPL is an extremely powerful tool for sifting through vast amounts of data and performing statistical operations on what is relevant in a specific context. Think SQL on steroids. And then some.
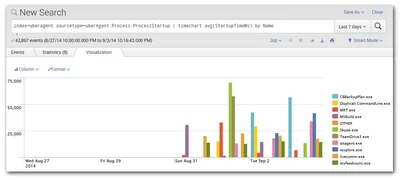
For example, you might want to know which applications are the slowest to start up, making the end-user wait the longest. The following search answers that. First, the relevant data is selected by specifying a so-called sourcetype (“ProcessStartup”). The result of this sub-command is piped ("|") to another command that groups the data by application (“by Name”), calculates the average for each group (“avg(StartupTimeMs)”), and charts the results’ distribution over time (“timechart”):
index=uberagent sourcetype=uberAgent:Process:ProcessStartup | timechart avg(StartupTimeMs) by Name
The result is something like this:
Apps, Add-ons and Data Sources
Reading the above you might wonder how Splunk knows about the duration of application starts. And you are right: by itself, it does not know anything. But it can receive data from a variety of sources: all kinds of log files, Windows event logs, Syslog, SNMP, to name a few. If the data you need cannot be found in any log you can write a script and direct Splunk to digest its output. If that still is not enough you should check Splunk’s App Directory for an add-on that collects the necessary data. In the example above the data was generated by uberAgent, vast limits’ user experience and application performance monitoring agent. uberAgent runs on the monitored endpoints independently of Splunk and sends the data it collects to Splunk for storage and further processing.
Splunk apps can be data inputs, but they can also contain dashboards that visualize what has been indexed by Splunk. In the case of uberAgent, both types are used: the actual agent acts as a data input while the dashboard app presents the collected data to the user. The former runs on the monitored Windows machines, the latter on your Splunk server(s).
Index, (no) Schema, Events
When first hearing about Splunk some think “database”. But that is a misconception. Where a database requires you to define tables and fields before you can store data Splunk accepts almost anything immediately after installation. In other words, Splunk does not have a fixed schema. Instead, it performs field extraction at search time. Many log formats are recognized automatically, everything else can be specified in configuration files or right in the search expression.
This approach allows for great flexibility. Just as Google crawls any web page without knowing anything about a site’s layout, Splunk indexes any kind of machine data that can be represented as text.
During the indexing phase, when Splunk processes incoming data and prepares it for storage, the indexer makes one significant modification: it chops up the stream of characters into individual events. Events typically correspond to lines in the log file being processed. Each event gets a timestamp, typically parsed directly from the input line, and a few other default properties like the originating machine. Then event keywords are added to an index file to speed up later searches and the event text is stored in a compressed file sitting right in the file system.
Scalability, (no) Backend
That brings us to the next point: there is no backend to manage, no database to set up, nothing. Splunk stores data directly in the file system. This is great for a number of reasons:
Installation is superfast. Splunk is available for more platforms than I can name here, but on Windows, you run the installer, click next a few times and you are done in less than five minutes.
Scalability is easy. If a single Splunk server is not enough you just add another one. Incoming data is automatically distributed evenly and searches are directed to all Splunk instances so that speed increases with the number of machines holding data. Optionally redundancy can be enabled so that each event is stored on two or more Splunk servers.
No single point of failure. I have seen too many environments where an overloaded database server slowed down half the applications in the data center without anyone finding the root cause. While this is a great use case for uberAgent my point is that this will not happen with Splunk.
Infinite retention without losing granularity. Some monitoring products only allow you to keep so many months, weeks or even days worth of data. Others reduce the granularity of older events, compressing many data points into one because of capacity limits. The same is not true for Splunk. It can literally index hundreds of terabytes per day and keep practically unlimited amounts of data. If you want to or need to compare the speed of last year’s user logons with today’s: go ahead!
Licensing, Download, Getting Started
If you would like to try out Splunk or uberAgent but do not really know where to start: our installation guide walks you through it.
Licensing in a nutshell: Splunk limits the amount of new data that can be indexed per day. A free version is available that is capped at 500 MB / day. When buying Splunk Enterprise licenses you buy daily indexed data volume, in other words gigabytes that can be added to Splunk per day. The number of Splunk servers the data is being stored on, how long you keep the data or over which periods of time you search is entirely up to you. Once the data is indexed, it is yours.
Happy splunking!


Comments