Benchmarking a $11,699 HP Enterprise Performance SSD
[Update on 29/06/2012: added tests 5 and 6 with RAID controller cache and Atlantis Ilio]
When a 400 GB SSD comes nearly at the price of a small car, you expect a lot, performance-wise. At least I did when I got my hands on two drives from HP’s enterprise performance series. Read on to find out if that hefty price tag is justified.
Test Environment

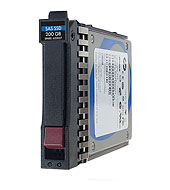
The two SSDs came in a ProLiant DL380 G7. The machine was a test/demo device. It was equipped with two Intel Xeon E5640 @ 2,67 GHz, 64 GB RAM and a Smart Array P410i RAID controller (without battery-backed write cache – keep that in mind for now, I will come back to it later). There were 6 2.5″ SAS drives installed: 2 15K drives with 146 GB capacity, 2 7.2K or 10K drives with 1 TB capacity and the 2 SSDs this article is all about: HP Enterprise Performance 400 GB, 6G, SLC, SAS (EO400FBRWA), data sheet, list price $11,699.
I tested the performance of the SSDs from virtual machines running on ESX 4.0. The VMs used local storage on the SSDs. Each VM had a size of 40 GB and was thickly provisioned. The guests’ OS was Windows 7 x64 SP1 with 8 GB RAM and 2 vCPUs. The VMFS version was 3.33 with a block size of 1 MB (smallest possible). No Citrix PVS or MCS anywhere in sight. Each VM had McAfee VirusScan Enterprise 8.8 installed.
All in all a typical case of persistent VDI, although on non-typical disk hardware.
IOMeter Configuration
I performed all tests with IOMeter (the 2006 version) configured as follows:
- Size of the test area on disk: 10,000,000 sectors (= 5,000,000 KB = 4,76 GB)
- 1 manager, 2 workers
- Transfer request size: 4 KB
- 100% random
- Aligned on sector boundaries
- Duration 1 minute
Test Results
Except where otherwise noted all tests were run 4 times. The value shown is the average of those 4.
Test 1: One VM Running
The VM was on a single-disk RAID-0. Only one instance of IOMeter was running in the single powered-on VM.
| # of outstanding IOs | 100% read | 100% write |
| 1 | 1,512 | 1,761 |
| 4 | 3,770 | 5,073 |
| 8 | 6,656 | 7,998 |
| 16 | 7,033 | 10,766 |
| 24 | 6,299 | 11,214 |
As can be clearly seen, the queue length needs to be high enough for the SSD to operate at peak performance. If chosen too high, performance drops again. This device seems to have its sweet spot somewhere between 16 and 24. I tested higher values but from 24 onwards performance got worse.
Two things are particularly striking about these results:
- Write IOPS are much higher than read IOPS. Usually it is the other way around.
- The IOPS are really low. According to the data sheet, the SSD should deliver 42,000 read IOPS and 13,300 write IOPS.
Test 2: Two VMs Running
I thought maybe this SSD delivers maximum performance only when concurrency is very high. To check that, I repeated the first test, but this time I ran two instances of IOMeter concurrently in two different virtual machines.
| # of outstanding IOs | 100% read | 100% write |
| 4×2 | 7,321 | 8,475 |
| 8×2 | 7,471 | 11,368 |
| 12×2 | 7,346 | 9,672 |
The performance is basically identical. Still looking for an explanation.
Test 3: Comparing with a Consumer SSD
To get a handle on the numbers I repeated the tests with the same OS image on an HP Elitebook 8560p laptop which was equipped with an Intel X25m 160 GB consumer SSD (SSDSA2M160G2HP).
| # of outstanding IOs | 100% read | 100% write |
| 1 | 5,056 | 5,361 |
| 4 | 18,012 | 9,512 |
| 8 | 28,652 | 10,284 |
| 16 | 37,730 | 9,928 |
| 32 | 45,216 | 11,071 |
| 48 | 45,121 | 10,314 |
The consumer drive peaks at a queue length of 32. As expected, its read IOPS are much higher than its write IOPS. Interestingly, the consumer SSD’s read IOPS are much higher than the server SSD’s read IOPS.
Test 4: Hypervisor Footprint
Could it be that the hypervisor somehow reduced the SSD’s performance? To test that I installed Windows Server 2008 R2 on the hardware, eliminating the hypervisor altogether and tested some more.
| # of outstanding IOs | 100% read | 100% write |
| 16 | 8,085 | 11,928 |
Although a little better than with ESX, the performance is substantially unchanged.
Other Considerations
To rule out the number of IOMeter workers, I performed an additional test with 8 workers per manager on the physical Windows installation. Here the write IOPS were 11985, nearly identical to the value with 2 workers.
Deleting the IOMeter file iobw.tst between tests did not change the results either.
I performed all tests without a battery-backed write cache on the RAID controller the disks were attached to. The reason for that is simple: the demo machine was configured that way and I did not have a cache module to play with. According to the SSD’s data sheet the difference in write performance should be 42% (18,900 write IOPS instead of 13,300). The data sheet does not say anything about read performance with the cache module.
Adding a RAID Controller Cache Module
A little while after this article was initially published we got a 1 GB battery-backed cache module for the Smart Array P410i. I repeated the test with this new configuration.
Test 5: With RAID Controller Cache Memory
Only two test runs per test here.
| # of outstanding IOs | 100% read | 100% write |
| 1 | 2,947 | 7,226 |
| 4 | 10,071 | 17,336 |
| 8 | 17,725 | 17,173 |
| 16 | 29,923 | 17,123 |
| 24 | 34,689 | 17,077 |
| 32 | 34,254 | 17,034 |
Now we’re talking! Apparently a RAID controller without cache memory is not much good.
Atlantis Ilio on Magnetic Drives
I am not sure whether this is a valid benchmark/comparison, but since we had the system in place I thought I might publish the numbers for a different configuration, too, just for the fun of it.
On the same server, I installed Atlantis Ilio, a very neat storage optimization product. In addition to deduplicating on the block level, Ilio also reduces IOPS by doing clever things like combining many smaller IOs into fewer larger ones.
Test 6: With RAID Controller Cache Memory
Only two test runs per test here.
Virtual machine located in an Ilio data store accessed via NFS. The store was placed on a RAID-0 array comprised of the server’s two 15K 146 GB disks.
| # of outstanding IOs | 100% read | 100% write |
| 1 | 4,700 | 3,397 |
| 4 | 7,694 | 5,454 |
| 8 | 8,916 | 6,085 |
| 16 | 12,363 | 8,194 |
| 24 | 12,178 | 8,003 |
| 32 | 14,256 | 8,486 |
Given that a 15K drive delivers at most 300 IOPS these are really astonishing numbers. In all honesty, I am not sure if maybe Ilio works better with IOMeter workloads than it does with real VDI user workloads.
Conclusion
The enterprise and the consumer SSDs differ in price by factor 17.5 (price per GB, calculated from the price of the X25m’s successor: $500 for 300 GB). That is a lot, given that the consumer device outperforms the enterprise drive in read performance by 30% and lags behind only 36% in write IOPS (at least in the workload used for this test). The enterprise SSD would need to be a lot more reliable to make up for the difference in price.
Apart from that I learned from these tests that there is no way around a cache module on a RAID controller. That got me thinking – when do we get the “real” (raw) performance of that enterprise SSD – with or without cache on the RAID controller? Naively I would say without – and the cache gives it a boost just as it would any other drive. Am I maybe wrong with this?
Finally, it is refreshing to see what kind of performance is possible with two 15K spindles and a little help from Atlantis Ilio. It looks like Ilio gives magnetic drives just the kind of boost they need to be usable in local disk VDI deployments.


7 Comments
Hey Helge,
if I´m not mistaken you would need to fill the disk somewhere near capacity (maybe 80%) and then run the performance tests. The reason is that when the disk is empty all writes are written into empty cells/pages. When the disk already contains data cells/pages have to be freed up first, which causes write amplification. In order to prevent that SSDs use some algorithms such as garbage collection and TRIM (if possible). The effectiveness of the algorithms and the behavior when no empty cells are available are the real performance differentiator. Check out http://support.citrix.com/article/CTX118397 (page 7/8) for further details.
Cheers,
Thomas
Hey Helge
I think you did missed two very important points
1) HP, Dell and such vendors have no clue of how an SSD works. If you want a good SSD then Intel is the brand to go. Fusion-IO is also an option. Intel also have Enterprise SSD’s like the 7xx and 9xx series, which are more expensive then the consumer models but still cheaper then HP!!
2) The testes between the HP SSD and the Intel SSD are very, very different. SSD’s are optimized to have Windows 2008 R2 or Windows 7 accessing them directly. You presented the HP SSD via VMWare, which most likely will block the TRIM instruction. I think if you present the SSD with RAM device mappings, you will get better results.
Hi Thomas – When you fill the SSD drive, it will be slower to write. So if Helge, started with a fresh new HP SSD drive or he wiped it out before starting the tests, then he was getting the full performance. The HP SSD drive is 400GB and he used 80GB (2 x 40GB), which leaves ample of space for sells to be written to the first time, before it will need to empty the cells before writing. .SSD wise, it’s irrelevant that Helge thick provisioned the volume, since that the SSD firmware will change the LBA mappings from what the drive presents to where it actually writes. VMWare overhead wise to expand the volume, then Thick provisioning helps since it will eliminate such process.
Have Storage Fun
Correct. This is why the drive should contain a significant amount of data before starting the test.
Hi Helge,
Is the McAffee software setup with disk encryption by any chance? This has been known to have an imact.
Also the P410i controller is known not to be best choice for SSD drives.I would test that by bypassing the controller
and connecting the SSD’s to the oboard SAS controller, set up a RAID0 from the OS software and re-run the test.
If you have the time, I’d be curious to the outcome.
best regards,
Marcel.
No disk encryption was used.
The HP SSD is SLC NAND and the Intel SSD is MLC NAND. The HP SSD will last much longer than consumer or prosumer MLC SSDs, especially when you’re writing terabytes on a continual basis.
Yes, the expensive disk contains SLC memory, which should last longer but also be much faster than MLC memory. But that is not the case.