Remarks on Windows Disk and File IO During System Boot
- Performance/Sizing, Windows Internals
- Published Jul 10, 2013
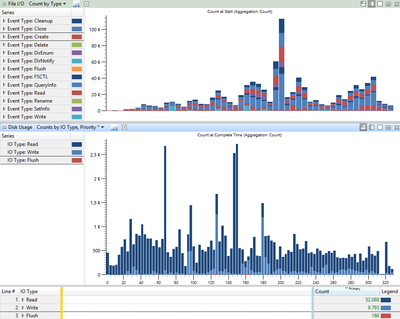
Let use take a look at some graphs I created with Windows Performance Analyzer (WPA), showing a typical corporate laptop boot Windows 7. Detailed information on creating such a trace can be found in my earlier article Analyzing a Slow Boot with Windows Performance Recorder & Analyzer.
Analysis
Several things can be learned analyzing the graphs:
- IO count and IOPS are much higher when measured at application level (top graph) versus at disk level (bottom graph) - notice the different scaling of the y-axis! See my earlier article The Impossibility of Measuring IOPS (Correctly) for more information on this topic.
- Contrary to popular belief the boot phase IO pattern shows not only reads, but a substantial amount of writes, too: 16% in this case. I am sorry about the colors, by the way. I tried but could not get WPA to change the colors so that reads and writes look less similar.
- Windows’ boot phase obviously is very IO intensive. In this case we have a total of 62,000 IOs over a time period of 330 seconds which amounts to 188 IOPS on average. That is not bad for a poor magnetic hard drive at all, but this system would benefit greatly from an SSD.
Bonus takeaway: IOPS are a function not only of the drive speed but also of the application(s) generating the IOs.


Comments