Monitor Boot Performance and Find the Cause for Delays with uberAgent for Splunk

Today it is still as common as it was in the 90s to go for a coffee after switching on the PC in the morning, only to find it still booting when coming back several minutes later. SSDs have not arrived in the average office yet, and even they can only cure some of the diseases that cause computers to start up agonizingly slowly.

Boot performance is to a PC what logon performance is to a terminal server.

One big difference from the 90s is that today many organizations start to realize the adverse effects of bad startup performance on employee productivity. Once they do so they need to find out where they stand. That is easy for a single boot process on a single PC - just time it with a stopwatch - but enterprises need more. They must be able to answer questions like the following:

  • What is the average boot duration over all PCs?
  • Is it getting better or worse over time?
  • Which PCs have the worst boot duration?

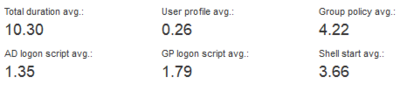
uberAgent for Splunk answers all these questions. It gives you trends:

Boot duration - trends

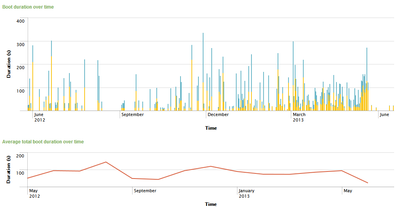
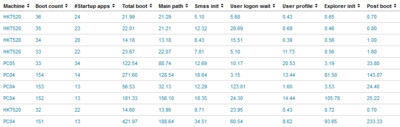
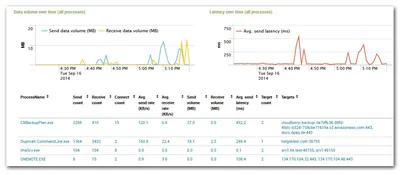
…as much detail as you want:

Boot duration - detail

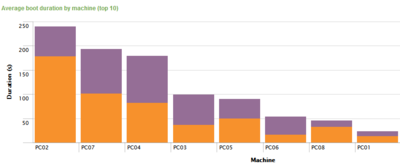
…and shows you which PCs really need attention:

Boot duration - worst PCs

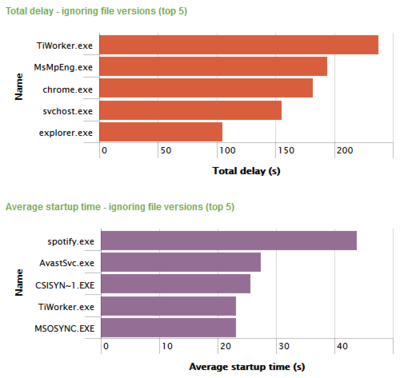
Finding the Root Cause

But that is not all: uberAgent also gives you likely causes for bad startup performance. Whether it is an application, a service or a driver, uberAgent shows you which component affects boot performance most:

Boot delays - worst components

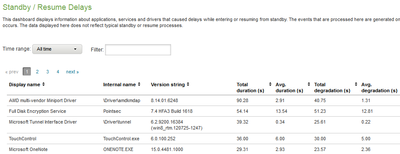
Standby, Resume and Shutdown

Problems with standby/resume and shutdown are just as common as boot issues and only marginally less effective in frustrating your users. Luckily uberAgent is just as effective in troubleshooting those kinds of on/off transitions as it is with system boot:

Standby-resume-delays-detail

Available Now

But the best thing is: all this goodness is available now! Try it yourself!

Comments

Related Posts

Monitoring Browser Performance per Site with uberAgent for Splunk

Monitoring Browser Performance per Site with uberAgent for Splunk
The days are long gone when a browser was just another application. Modern websites are applications of their own, and the browser is their operating system. That has consequences for monitoring. It is no longer sufficient to gather performance data for the browser as a whole. When, for example, Internet Explorer’s CPU usage is high, Administrators need to understand what caused that. Is it the business-critical ERP site or are people just watching fun videos on YouTube?
Logs & Metrics

How-to: XenApp/RDS Sizing and Capacity Planning with uberAgent for Splunk

How-to: XenApp/RDS Sizing and Capacity Planning with uberAgent for Splunk
Do you know the maximum number of users each of your terminal servers can host with acceptable performance? You may have found out the hard way how many are too many - but how many are just right? Farm sizing and server capacity planning are typical tasks for consultants who often have a hard time fighting the peculiarities of perfmon and logman trying to get the data they need for their calculations. It can be so much easier at no additional cost. The 60-day Enterprise Trial version of Splunk in conjunction with an evaluation license of uberAgent give all the information you need in much less time. Here is how.
Citrix/Terminal Services/Remote Desktop Services

Latest Posts

Fast & Silent 5 Watt PC: Minimizing Idle Power Usage

Fast & Silent 5 Watt PC: Minimizing Idle Power Usage
This micro-series explains how to turn the Lenovo ThinkCentre M90t Gen 6 into a smart workstation that consumes only 5 Watts when idle but reaches top Cinebench scores while staying almost imperceptibly silent. In the first post, I showed how to silence the machine by replacing and adding to Lenovo’s CPU cooler. In this second post, I’m listing the exact configuration that achieves the lofty goal of combining minimal idle power consumption with top Cinebench scores.
Hardware