Grafana Setup Guide With Automatic HTTPS & OAuth SSO via Authelia
- Home Automation, Networking & Self-Hosting
- Published Jul 29, 2023 Updated Apr 19, 2025
This article explains how to set up Grafana, Loki, and Promtail with automatic HTTPS certificates (via Caddy) and OAuth single sign-on (via Authelia). This post is part of my series on home automation, networking & self-hosting that shows how to install, configure, and run a home server & network with dockerized or virtualized services.
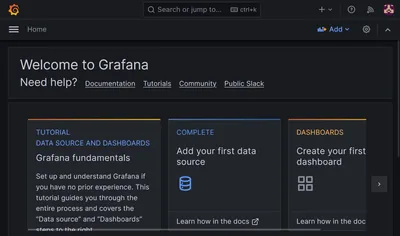
What are Grafana, Loki & Promtail?
Grafana is a data visualization platform that supports a wide variety of data sources, most notably Prometheus and Loki. Prometheus (subject of a future post) stores metrics data as time series and makes it searchable via its query language, PromQL. Loki is similar in nature to Prometheus but operates on log data instead; its query language LogQL was inspired by Prometheus’ PromQL. Promtail is a log shipping tool that collects logs and forwards them to Loki.
Grafana, Loki & Promtail Installation
Preparation
I’m assuming that you’ve set up Docker, the Caddy container, and Authelia as described in the previous articles in this series. I’m also assuming that you’ve configured Authelia as OpenID Connect IdP as described in my ownCloud article.
Dockerized Grafana Directory Structure
This is what the directory structure will look like when we’re done:
rpool/
 └── encrypted/
     └── docker/
         └── grafana/
             ├── data/
                 ├── grafana/
                 ├── loki/
                 └── promtail/
             ├── config/
                 ├── grafana/
                     └── grafana.ini
                 ├── loki/
                     └── local-config.yml
                 └── promtail/
                     └── config.yml
             └── docker-compose.yml
We’re placing the configuration on the encrypted ZFS dataset (rpool/encrypted).
Create the directories and files. Set ownership of Grafana directories to user/group ID 472, which are used by dockerized Grafana (sadly, not officially documented). Set ownership of Loki directories to user/group ID 10001, which are used by dockerized Loki (docs).
mkdir -p /rpool/encrypted/docker/grafana/data/grafana
mkdir -p /rpool/encrypted/docker/grafana/data/loki
mkdir -p /rpool/encrypted/docker/grafana/data/promtail
mkdir -p /rpool/encrypted/docker/grafana/config/grafana
touch /rpool/encrypted/docker/grafana/config/grafana/grafana.ini
mkdir -p /rpool/encrypted/docker/grafana/config/loki
mkdir -p /rpool/encrypted/docker/grafana/config/promtail
chown -Rfv 472:472 /rpool/encrypted/docker/grafana/data/grafana/
chown 472:472 /rpool/encrypted/docker/grafana/config/grafana/grafana.ini
chown -Rfv 10001:10001 /rpool/encrypted/docker/grafana/data/loki/
Grafana Docker Compose File
Create docker-compose.yml with the following content:
services:

  grafana:
    container_name: grafana
    hostname: grafana
    image: grafana/grafana-oss:latest
    restart: unless-stopped
    networks:
      backend:              # backend communications
      caddy_caddynet:       # frontend communications (web UI)
    expose:
      - 3000                # Web UI
    volumes:
      - /etc/localtime:/etc/localtime:ro
      - ./config/grafana/grafana.ini:/etc/grafana/grafana.ini:ro
      - ./data/grafana:/var/lib/grafana

  loki:
    container_name: loki
    hostname: loki
    image: grafana/loki:latest
    restart: unless-stopped
    networks:
      - backend
    expose:
      - 3100                # HTTP API
      - 9095                # gRPC
    volumes:
      - /etc/localtime:/etc/localtime:ro
      - ./config/loki:/etc/loki:ro
      - ./data/loki:/loki
    command: ["-config.file=/etc/loki/local-config.yml"]

  promtail:
    container_name: promtail
    hostname: promtail
    image: grafana/promtail:latest
    restart: unless-stopped
    networks:
      - backend
    ports:
      - 1514:1514
    volumes:
      - /etc/localtime:/etc/localtime:ro
      - ./config/promtail:/etc/promtail:ro
      - ./data/promtail:/promtail
    depends_on:
      - loki

networks:
  caddy_caddynet:
    external: true
  backend:
    driver: bridge
Note: The above YAML file references the open-source (OSS) image of Grafana. To use the enterprise image instead, replace grafana/grafana-oss:latest with grafana/grafana-enterprise:latest.
Loki YAML Configuration File
We’re using a customized version of Grafana’s Loki configuration template. Create config/loki/local-config.yml with the following content:
auth_enabled: false

server:
  http_listen_port: 3100
  grpc_listen_port: 9095

common:
  path_prefix: /loki
  storage:
    filesystem:
      chunks_directory: /loki/chunks
      rules_directory: /loki/rules
  replication_factor: 1
  ring:
    kvstore:
      store: inmemory

schema_config:
  configs:
    - from: 2020-10-24
      store: boltdb-shipper
      object_store: filesystem
      schema: v11
      index:
        prefix: index_
        period: 24h
    - from: 2025-03-14
      store: tsdb
      object_store: filesystem
      schema: v13
      index:
        prefix: index_
        period: 24h

ruler:
  alertmanager_url: http://localhost:9093

analytics:
  # Disable usage statistics reporting to Grafana
  reporting_enabled: false

# Enable data retention management through compactor
compactor:
  retention_enabled: true
  delete_request_store: filesystem

# Set the data retention period
limits_config:
  retention_period: 90d

# Work around GitHub issue #5123 (too many outstanding requests)
query_scheduler:
  max_outstanding_requests_per_tenant: 10000
Promtail Configuration File
For now, we’ll only provide a minimal Promtail configuration. The following disables Promtail’s built-in server and specifies our Loki instance as the data receiver. Note that this doesn’t configure Promtail to collect any data - that’s going to be the subject of a future post.
Create config/promtail/config.yml with the following content:
# Disable the HTTP and GRPC server.
server:
  disable: true

positions:
  filename: /promtail/positions.yml

# Send (push) all data to Loki
clients:
  - url: http://loki:3100/loki/api/v1/push
Grafana Configuration File
Create config/grafana/grafana.ini with the following content:
[date_formats]
full_date = YYYY-MM-DD @ HH:mm:ss
interval_second = HH:mm:ss
interval_minute = HH:mm
interval_hour = DD.MM. HH:mm
interval_day = DD.MM.
interval_month = MM-YYYY
interval_year = YYYY
**Note:**The [date_formats] section sets Grafana’s (chart) date format to a sensible international standard.
Start the Grafana Containers
Navigate into the directory with docker-compose.yml and run:
docker compose up -d
Inspect the container logs for errors with the command docker compose logs --tail 30 --timestamps.
Let’s Encrypt Certificate for Grafana via Caddy
Caddyfile
Add the following to Caddyfile (details):
grafana.{$MY_DOMAIN} {
	reverse_proxy grafana:3000
	tls {
		dns cloudflare {env.CLOUDFLARE_API_TOKEN}
	}
}
DNS A Record
Add the following A record to your DNS domain:
grafana.home.yourdomain.com 192.168.0.4 # replace with your Docker host's IP address
Try to resolve the name on a machine in your network (e.g., nslookup grafana.home.yourdomain.com). If that fails, you might need to work around DNS rebind protection in your router.
Reload Caddy’s Configuration
Instruct Caddy to reload its configuration by running:
docker exec -w /etc/caddy caddy caddy reload
You should now be able to access the Grafana web interface at https://grafana.home.yourdomain.com without getting a certificate warning from your browser.
Initial Grafana Configuration
Open https://grafana.home.yourdomain.com in your browser. You’re asked to set a password for the user admin.
Add Loki Connection as Data Source
Configure Grafana to connect to and search Loki data by navigating to Home > Connections > Add new connection > Loki, click Create a Loki data source and specify the following:
- URL:
http://loki:3100
When clicking Save & test, you’ll get the message: Data source connected, but no labels were received. Verify that Loki and Promtail are correctly configured. That’s OK; after all, we haven’t configured any data sources in Promtail yet, so there’s no data in Loki.
SSO to Grafana via OpenID Connect (OIDC) Authentication to Authelia
This section describes how to set up single sign-on to Grafana via OpenID Connect authentication to Authelia. It is based on the Authelia Grafana integration guide.
Authelia: Configure OpenID Connect IdP
Client ID
Generate a random alphanumeric string to be used as client ID:
tr -cd '[:alnum:]' < /dev/urandom | fold -w "64" | head -n 1
Copy the generated string for later use in Authelia’s config file.
Client Secret
The shared secret between Grafana and Authelia is entered as plaintext in the Grafana UI but as a hash of the plaintext in Authelia’s configuration. Create a new secret by running the following command (docs):
docker run authelia/authelia:latest authelia crypto hash generate pbkdf2 --random --random.length 32 --random.charset alphanumeric
The command’s relevant output looks as follows:
Random Password: v0e1zWJhvKQYud1lVUx4XhLibOwp0zyd
Digest: $pbkdf2-sha512$310000$vFbvgWgmhAIdZCbcLsrrXA$yRENW40rZpWLUP2ABQglEAhIHgpl7QAJ3eq8ZDEMmEHDL9Rro3eGwQ/4u05JsSLsEO5NIw.iAWVbo7EsiL8V1w
From the above output, the following two strings are required:
- Plaintext secret: v0e1zWJhvKQYud1lVUx4XhLibOwp0zyd
- Hashed secret: $pbkdf2-sha512$310000$vFbvgWgmhAIdZCbcLsrrXA$yRENW40rZpWLUP2ABQglEAhIHgpl7QAJ3eq8ZDEMmEHDL9Rro3eGwQ/4u05JsSLsEO5NIw.iAWVbo7EsiL8V1w
Note: do not use the above values. Create your own!
YAML Configuration File
Add the following to the oidc: section of Authelia’s configuration file config/configuration.yml (details):
    clients:
      - client_id: lQ6vsAawaJYH53gSfiUSXKT5XxFYmVjt5o5iFSvOiIgz7wd3lyycNaQpXMo8VhgB  # Replace with your own random ID
        client_name: Grafana
        client_secret: '$pbkdf2-sha512$310000$vFbvgWgmhAIdZCbcLsrrXA$yRENW40rZpWLUP2ABQglEAhIHgpl7QAJ3eq8ZDEMmEHDL9Rro3eGwQ/4u05JsSLsEO5NIw.iAWVbo7EsiL8V1w'  # Replace with your own hashed secret
        redirect_uris:
          - https://grafana.home.yourdomain.com/login/generic_oauth  # Replace with your own URL
        scopes:
          - openid
          - profile
          - groups
          - email
        userinfo_signed_response_alg: none
Restart Authelia
We changed the container’s environment, which makes it necessary to recreate the container (stopping and starting is not enough). Navigate into the authelia directory and run:
docker compose down
docker compose up -d
Inspect the container logs for errors with the command docker compose logs --tail 30 --timestamps.
Grafana: Enable OIDC Authentication
Add the following to config/grafana/grafana.ini:
[server]
root_url = https://grafana.home.yourdomain.com                      # Replace with your own URL

[auth.generic_oauth]
enabled = true
name = Authelia
icon = signin
client_id = lQ6vsAawaJYH53gSfiUSXKT5XxFYmVjt5o5iFSvOiIgz7wd3lyycNaQpXMo8VhgB  # Replace with your own random ID
client_secret = v0e1zWJhvKQYud1lVUx4XhLibOwp0zyd                    # Replace with your plaintext secret
scopes = openid profile email groups
empty_scopes = false
auth_url = https://auth.home.yourdomain.com/api/oidc/authorization  # Replace with your own URL
token_url = https://auth.home.yourdomain.com/api/oidc/token         # Replace with your own URL
api_url = https://auth.home.yourdomain.com/api/oidc/userinfo        # Replace with your own URL
login_attribute_path = preferred_username
groups_attribute_path = groups
name_attribute_path = name
# Assign Grafana permissions depending on group membership:
# grafana_admin => Admin
# [otherwise]   => Viewer
role_attribute_path = contains(groups, 'grafana_admin') && 'Admin' || 'Viewer'
use_pkce = true
Restart Grafana
Navigate into the grafana directory and run:
docker compose stop
docker compose start
Inspect the container logs for errors with the command docker compose logs --tail 30 --timestamps.
Grafana Admin Group
In lldap, create a group named grafana_admin and add your user account as a member.
Log In via OAuth
In a different browser, access https://grafana.home.yourdomain.com. Click Sign in with Authelia. It should work without a hitch.
Assign Admin Permissions
When you first log in via SSO, Grafana creates a new user account with the data from Authelia. We’ll assign admin permissions to this new user by signing back in as user admin, navigating to Administration > Users, and setting Grafana Admin to yes.
The new user’s Grafana organization role is synchronized from lldap’s group membership. Verify that the user is an organization admin by navigating to Administration > Organizations.
Enable Auto-Login and Disable Local Authentication
Now that SSO is fully set up we can configure Grafana to automatically log in via OAuth, bypassing its login screen entirely. We can also disable basic (local) authentication. Add the following to config/grafana/grafana.ini and restart Grafana:
[auth.generic_oauth]
auto_login = true

[auth.basic]
enabled = false
Changelog
2025-03-14 Loki Changes
- Changed Loki’s store from
boltdb-shippertotsdb(docs) - Added required Compactor setting
delete_request_store: filesystem
2024-04-14
- Removed the
versionfromdocker-compose.yml; a warning mentions that it’s obsolete.
2024-04-05
- Grafana: Added sensible (non-US) date format specification.
2024-04-04
- Grafana: The organization role is now set depending on group membership in lldap.
- Loki: Added
max_outstanding_requests_per_tenantto work around the error too many outstanding requests.
2024-03-17
Updated Configuration for Authelia 4.38
The following Authelia settings need to be changed or updated:
- Rename
oidc.clients.idtooidc.clients.client_id. - Rename
oidc.clients.descriptiontooidc.clients.client_name. - Rename
oidc.clients.secrettooidc.clients.client_secret. - Rename
userinfo_signing_algorithmtouserinfo_signed_response_alg.
2024-02-25
- Added Promtail data directory for
promtail-positions.yml. - Added Loki data retention configuration.





Comments