Docker Monitoring With Prometheus, Automatic HTTPS & SSO Authentication
- Home Automation, Networking & Self-Hosting
- Published Aug 21, 2023 Updated Apr 19, 2025
This article, effectively part 2 of my Grafana setup guide, explains how to set up Prometheus, Node Exporter, and cAdvisor with automatic HTTPS certificates (via Caddy) and OAuth single sign-on (via Authelia). This post is part of my series on home automation, networking & self-hosting that shows how to install, configure, and run a home server & network with dockerized or virtualized services.
What are Prometheus, Node Exporter & cAdvisor?
Prometheus stores metrics (but not log) data as time series and makes it searchable via its query language, PromQL. It ingests data by scraping (pulling from) data sources like Node Exporter or cAdvisor. Node Exporter is a data collector agent for Linux OS metrics designed to present (export) its collected data to Prometheus. cAdvisor collects (mostly) Docker container performance data and presents (exports) it to Prometheus.
Node Exporter Installation
Text File Directory
Create a directory for text files to be picked up by Node Exporter:
mkdir /etc/node-exporter/
Node Exporter Docker Compose File
Add the following services to the existing docker-compose.yml:
  node-exporter:
    container_name: node-exporter
    hostname: node-exporter
    image: prom/node-exporter:latest
    restart: unless-stopped
    networks:
      backend:              # backend communications
    expose:
      - 9100
    volumes:
      - /proc:/host/proc:ro
      - /sys:/host/sys:ro
      - /:/rootfs:ro
      - /etc/node-exporter:/etc/node-exporter:ro
    command:
      - '--path.procfs=/host/proc'
      - '--path.rootfs=/rootfs'
      - '--path.sysfs=/host/sys'
      - '--collector.filesystem.mount-points-exclude=^/(sys|proc|dev|host|etc)($$|/)'
      - '--collector.textfile.directory=/etc/node-exporter'
cAdvisor Installation
cAdvisor CPU Usage Optimization
Apparently, cAdvisor is notorious for consuming a lot of CPU resources in its default configuration (sources: 1, 2, 3, 4). Luckily, that can be remedied fairly easily by changing the following runtime options and by removing most (unnecessary?) metrics:
housekeeping_interval: how often per-container metrics are collected. The default of 1 second is way over the top.docker_only: if set totrue, only collects data for Docker containers.enable_metrics: by default, cAdvisor collects a huge number of metrics. By using this option, only the specified metrics are included; everything else is ignored.
With the optimized settings presented here, I was able to reduce the CPU usage of the cAdvisor container to approximately 0.1% - less than most other containers and right where I expect a fairly simple monitoring solution to be.
cAdvisor Docker Compose File
Add the following services to the existing docker-compose.yml:
  cadvisor:
    container_name: cadvisor
    hostname: cadvisor
    image: gcr.io/cadvisor/cadvisor:v0.47.2
    restart: unless-stopped
    privileged: true        # Without this I got the error: "Failed to initialize the libzfs library."
    networks:
      backend:              # backend communications
      caddy_caddynet:       # frontend communications (web UI)
    expose:
      - 8080
    volumes:
      - /etc/localtime:/etc/localtime:ro
      - /etc/machine-id:/etc/machine-id:ro
      - /:/rootfs:ro
      - /dev/disk/:/dev/disk:ro
      - /sys:/sys:ro
      - /var/run:/var/run:ro
      - /var/lib/docker/:/var/lib/docker:ro
    devices:
      - /dev/zfs:/dev/zfs:ro              # Required for ZFS monitoring
    command:
      - "--storage_duration=5m0s"         # Increase local in-memory storage from 2m to 5m
      - "--housekeeping_interval=60s"
      - "--docker_only=true"
      - "--enable_metrics=cpu,memory,network"
Normally, I’d use the latestversion, but in this case, the latest tag absurdly points to version v0.38.6 from 2020. A related issue is apparently being ignored.
Start the cAdvisor Container
Navigate into the directory with docker-compose.yml and run:
docker compose up -d
Inspect the container logs for errors with the command docker compose logs -f cadvisor --tail 30 --timestamps. I only got a single (occasionally repeated) warning:
W0819 machine_libipmctl.go:64] There are no NVM devices!
If you find out how to get rid of that, please let me know in the comments.
Prometheus Installation
Preparation
I’m assuming that you’ve set up Grafana as described in my earlier article.
Dockerized Prometheus Directory Structure
We’re adding the Prometheus container to the existing Grafana setup. This is what the directory structure will look like when we’re done:
rpool/
 └── encrypted/
     └── docker/
         └── grafana/
             ├── data/
                 ├── grafana/
                 ├── loki/
                 └── prometheus/
             ├── config/
                 ├── grafana/
                     └── grafana.ini
                 ├── loki/
                     └── local-config.yml
                 ├── prometheus/
                     └── prometheus.yml
                 └── promtail/
                     └── config.yml
             └── docker-compose.yml
Create the new directories and files. Set ownership of the Prometheus data directory to user/group ID 65534, which are used by dockerized Prometheus.
mkdir -p /rpool/encrypted/docker/grafana/data/prometheus
chown -Rfv 65534:65534 /rpool/encrypted/docker/grafana/data/prometheus/
mkdir -p /rpool/encrypted/docker/grafana/config/prometheus
touch /rpool/encrypted/docker/grafana/config/prometheus/prometheus.yml
Prometheus Docker Compose File
Add the following services to the existing docker-compose.yml:
   prometheus:
    container_name: prometheus
    hostname: prometheus
    image: prom/prometheus:latest
    restart: unless-stopped
    networks:
      backend:              # backend communications
      caddy_caddynet:       # frontend communications (web UI)
    expose:
      - 9090                # Web UI
    volumes:
      - /etc/localtime:/etc/localtime:ro
      - ./config/prometheus/prometheus.yml:/etc/prometheus/prometheus.yml:ro
      - ./data/prometheus:/prometheus
    command:
      - '--log.level=debug'                   # Log scrape errors &  additional useful info
      - '--config.file=/etc/prometheus/prometheus.yml'
      - '--storage.tsdb.retention.time=90d'   # Increase data retention from 15 to 90 days
    extra_hosts:
      - "host.docker.internal:host-gateway"
The extra_hosts section allows us to add entries to the container’s hosts file. We use it for the special entry host.docker.internal, which is shorthand for the host’s IP address.
Prometheus YAML Configuration File
Create config/prometheus/prometheus.yml with the following content:
global:
  # Increase default scrape interval from 1 to 2 minutes
  scrape_interval: 2m

scrape_configs:
  - job_name: 'prometheus'
    static_configs:
      - targets: ['localhost:9090']

  - job_name: 'node'
    static_configs:
      - targets: ['node-exporter:9100']

  - job_name: 'cadvisor'
    static_configs:
    - targets: ['cadvisor:8080']
The above configures Prometheus to scrape data from itself as well as from Node Exporter and from cAdvisor every two minutes.
Start the Prometheus Container
Navigate into the directory with docker-compose.yml and run:
docker compose up -d
Inspect the container logs for errors with the command docker compose logs -f prometheus --tail 30 --timestamps.
Authentication & Let’s Encrypt Certificate for Prometheus via Caddy
Absurdly, Prometheus doesn’t come with a user authentication system. If you’re exposing Prometheus’ web interface as we’re doing, it’s mandatory to put it behind a reverse proxy that requires authentication. Luckily, our trusted Caddy handles that elegantly.
Caddyfile
Add the following to Caddyfile (details):
prometheus.{$MY_DOMAIN} {
	import auth
	reverse_proxy prometheus:9090
	tls {
		dns cloudflare {env.CLOUDFLARE_API_TOKEN}
	}
}
Note: the definition of the auth snippet can be found here.
DNS A Record
Add the following A record to your DNS domain:
prometheus.home.yourdomain.com 192.168.0.4 # replace with your Docker host's IP address
Try to resolve the name on a machine in your network (e.g., nslookup prometheus.home.yourdomain.com). If that fails, you might need to work around DNS rebind protection in your router.
Reload Caddy’s Configuration
Instruct Caddy to reload its configuration by running:
docker exec -w /etc/caddy caddy caddy reload
You should now be able to access the Prometheus web interface at https://prometheus.home.yourdomain.com without getting a certificate warning from your browser.
Authentication & Let’s Encrypt Certificate for cAdvisor via Caddy
cAdvisor doesn’t come with a user authentication system. If you’re exposing its web interface as we’re doing, it’s mandatory to put it behind a reverse proxy that requires authentication. Luckily, our trusted Caddy handles that elegantly.
Caddyfile
Add the following to Caddyfile (details):
cadvisor.{$MY_DOMAIN} {
	import auth
	reverse_proxy cadvisor:8080
	tls {
		dns cloudflare {env.CLOUDFLARE_API_TOKEN}
	}
}
Note: the definition of the auth snippet can be found here.
DNS A Record
Add the following A record to your DNS domain:
cadvisor.home.yourdomain.com 192.168.0.4 # replace with your Docker host's IP address
Try to resolve the name on a machine in your network (e.g., nslookup cadvisor.home.yourdomain.com). If that fails, you might need to work around DNS rebind protection in your router.
Reload Caddy’s Configuration
Instruct Caddy to reload its configuration by running:
docker exec -w /etc/caddy caddy caddy reload
You should now be able to access the cAdvisor web interface at https://cadvisor.home.yourdomain.com without getting a certificate warning from your browser.
Visualizing Prometheus Data in Grafana
Prometheus Data Source in Grafana
In Grafana, navigate to Menu > Connections > Prometheus > Create a Prometheus data source and specify the following settings:
- Prometheus server URL:
http://prometheus:9090(this connection uses the internal Docker networkbackend. It doesn’t go through Caddy.) - Scrape interval:
60s - Prometheus type:
Prometheus
Click Save & test. You should get the message: Successfully queried the Prometheus API.
Import Dashboards
Grafana’s Dashboards page lists thousands of dashboards - of varying quality - that can be used in your Grafana instance.
Node Exporter Full
Helped by the site’s filtering capabilities, I quickly identified Node Exporter Full (ID 1860) as the most popular and best-rated dashboard for Linux monitoring via Prometheus and Node Exporter.
To import the dashboard in Grafana, navigate to Menu > Dashboards > New > Import, enter the ID 1860, and click Load. Select the Prometheus data source of the same name and click Import.
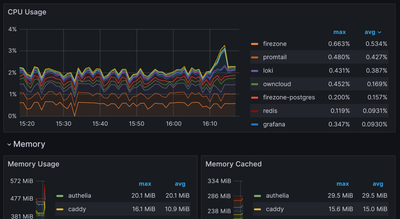
cAdvisor Exporter
The cAdvisor Exporter dashboard gives a concise overview of the CPU, memory, and network utilization per container over time. Just what I need to ensure that all containers are well-behaved. Install the dashboard in the same way you installed the one above, but using the ID 14282.
Changelog
2025-03-04
- Caddy config: replaced the explicit
forward_authdefinition with a snippet import.
2024-04-07
- Node Exporter: Added a text file directory data collection configuration.
2024-03-31
- Node Exporter: Replaced the native host installation with a dockerized setup because the natively installed Node Exporter would always stop after a while.


Comments