XenApp and RDS Sizing Part 3 – Determining Farm Load
- Citrix/Terminal Services/Remote Desktop Services, Performance/Sizing
- Published Nov 21, 2012 Updated Dec 30, 2025
This article is part of a mini-series. You can find the other articles here.
In the previous part of this series we saw how to determine the capacity of a server farm. This time we will look at how that capacity is utilized, in other words at farm load. As before we will do that for the four main components of a XenApp server separately: CPU, memory, storage and network.
Observation
Before spending lots of time with Perfmon you should try to get a feel for the farm. The easiest way to do that is by opening Task Manager on a few servers and taking a good look. Task Manager is probably a bit underestimated when it comes to monitoring a system, yet it can help answer many important questions:
- How many users per server?
- What is the utilization of CPU, memory, network?
- Are there individual processes with high CPU/memory usage?
After adding a few additional columns, Task Manager happily displays IO counts, too.
Having examined several systems like this, you should have a rough idea of the utilization of each of the four key system components (CPU, memory, storage and network). For example you might have come to the conclusion that the servers are memory-constrained, CPU load is rather low, disk IO is high mainly during logon hours and the NICS are heavily underused (that is a combination I have seen lately).
In the next step, we will verify the initial assessment with measurements.
Measurements
Perfmon is the way to go here. The most relevant counters for understanding system performance are listed below.
General System Activity
These are self-explanatory:
\Terminal Services\Active Sessions
\Terminal Services\Inactive Sessions
\Terminal Services\Total Sessions
Hard Disk Activity
Measuring hard disk load is difficult, as there is no single number telling you what a disk is doing. To have all the data we might need later on we will measure overall utilization (% Disk Time), queue length (requests waiting to be processed, Avg. Disk Queue Length), IOPS (requests being processed, Disk Reads/sec and Disk Writes/sec) and latency (Avg. Disk sec/Transfer):
\PhysicalDisk(_Total)\% Disk Time
\PhysicalDisk(_Total)\Avg. Disk Queue Length
\PhysicalDisk(_Total)\Disk Reads/sec
\PhysicalDisk(_Total)\Disk Writes/sec
\PhysicalDisk(_Total)\Avg. Disk sec/Transfer
CPU, Memory and Network Activity
Compared to storage, the activity of the other system components is simple to measure. We need but one counter per component:
\Processor(_Total)\% Processor Time
\Memory\Available MBytes
\Network Interface(*)\Bytes Total/sec
However, there is one caveat: Windows does not tell us the amount of memory that is used (which is what we really want to know) but the amount of memory that is available. Calculation of consumed memory requires knowledge of the total amount of memory installed in a system. See the previous article for that.
Automation
Obviously nobody wants to log on to dozens of servers setting up eleven counters manually in Perfmon (Perfmon’s horrible UI does not exactly help this). Fortunately, nobody needs to as this can be automated easily. Create a text file containing the names of all servers you want to collect data on (one name per line) and save it as Servers.txt. Paste the names of the counters you want to include into another text file and save it as Counters.txt. Run the following command (line breaks for readability only):
for /f %i in (Servers.txt) do
    logman create counter TSPerf -f csv -cf C:\PerfLogs\Counters.txt
                                 -o C:\PerfLogs\%i.csv
                                 -si 60 -rf 24:00:00
                                 -s %i
This creates one data collector set on each server in the list, adds all the counters from Counters.txt to the set, sets the output format to CSV, the output file to Servername.csv, the sampling interval to 60 seconds and the total runtime (collection duration) to 24 hours.
Once created, the data collector set can be started at any time by running the following:
for /f %i in (Servers.txt) do logman start TSPerf -s %i
Analysis
Once performance data from a typical work day is available, analyze two or three individual servers. Perform the analysis per component (CPU, memory, storage, network). For each component, create a chart that depicts total session count and the counter for the component.
CPU
A CPU chart could look like this:
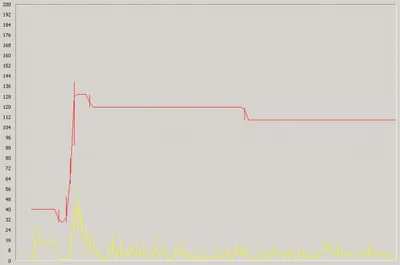
The yellow graph represents CPU utilization in percent, the red graph the total number of sessions (multiplied by 10 to fit into the same scale). It is obvious that during the morning logon time as the session count increases, CPU utilization is noticeable, though not high. During the rest of the day CPU utilization is negligible. This machine is obviously not CPU-limited.
Repeat the single server analysis with another machine. If you feel that you understand the component’s load in the farm, verify your analysis by overlaying many servers’ graphs in a single chart like this:
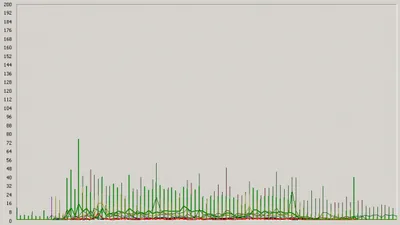
This is very good evidence that the farm’s CPU load is light, rarely crossing the 40% threshold, often being below 20%.
Memory
Memory charts look like inverted CPU charts because Perfmon monitors available, not free RAM:
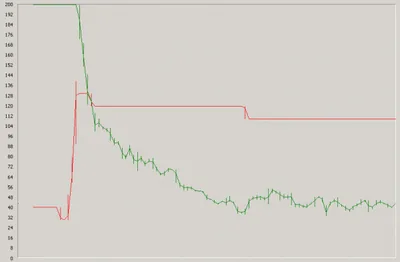
When analysing such a chart do not fall into the trap of thinking that there is lots of RAM available because the graph does not reach zero. If you want a snappy system (and happy users) you need several hundred megabytes for the file system cache. This server could do with a little more RAM, for example.
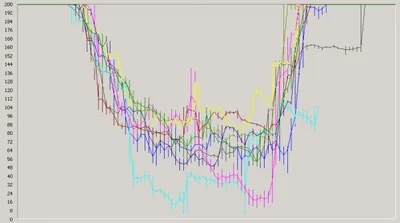
Again, verify your analysis by creating an overlay like this one:
Storage
Load
The average disk queue length is a good indicator for the load of a storage system:
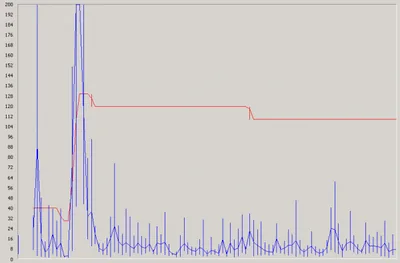
The blue graph shows the disk queue length multiplied by 100. A queue length of 2 is considered full load for a single active disk. In a typical RAID-1 configuration, only one disk is active, so the value of 200 in the chart represents full load. As disk performance is critical for application responsiveness this server’s disks should be considered being under medium load.
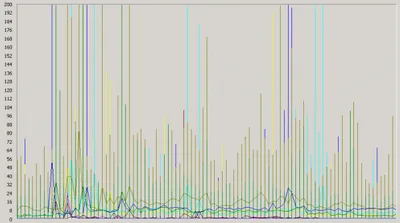
As before, the overlay confirms the analysis.
IOPS
In addition to determining the load of the disk subsystem it is often necessary to have the number of IO operations per second (IOPS). We can use an overlay chart with disk reads and writes:
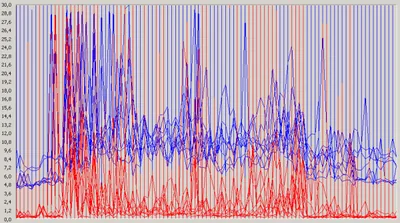
With the system in steady state (i.e. booted up), the number of writes (blue) is much higher than the number of reads (red). We want a good reaction time from the system, so we use peak values instead of averages. The combined peak read and write IOPS of this machine is at around 60.
Network
When looking at the network chart please note that a value of 200 corresponds to only 2 MB/s.
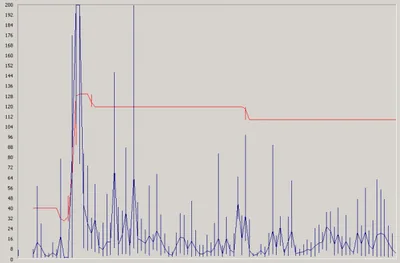
The average network utilization of this system is less than 200 KB/s - which is practically nothing. The overlay chart confirms that the same is true for all servers:
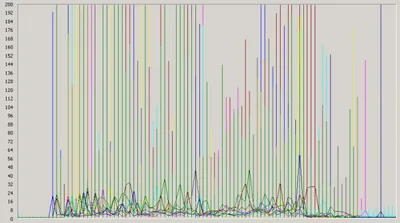
This is an extremely light load.
Summary
Now that we know each component’s capacity and load, we can go about calculating the size of the new farm. That is the topic of the next article.



Comments