The Impossibility of Measuring IOPS (Correctly)
- Performance/Sizing, UberAgent
- Published Mar 13, 2013 Updated Feb 23, 2021
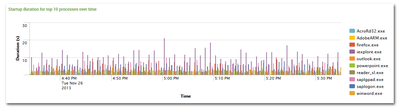
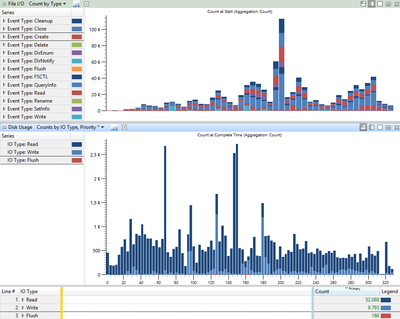
If you have ever used Sysinternals’ Process Monitor, chances are high you were a little intimidated when you looked at your first capture: it probably contained hundreds of thousands of registry and file system events, generated in a minute or less. That amount of activity must surely indicate high system load - but strangely, very often it does not. Looking at the hard disk LED you will only see an occasional flickering, even though thousands of file system events are captured per second. How is that possible? Read on to find out.
Layers
The main problem with measuring I/O operations per second (IOPS) is how to define what an I/O operation (short: IO) actually is. Depending on where you look, IOs can be entirely different things.
Application
Take a typical application. When it wants to write to a file it calls the appropriate function from the framework the developer chose to make his life easier. In case of C++ that function might be fputs. From the application’s point of view, each call to fputs constitutes an IO. But that does not mean that the IO even reaches the disk. There is still a long way to go to permanent storage. On the way the IO could be cached, redirected, split, torn apart, and put back together. Let’s travel down the layers and see what happens.
Framework
To prevent applications from saturating the disk with many small IOs the framework buffers IOs until they reach 4K in total size. Then the data is flushed, aka written to disk in a single operation. This happens by calling the Windows API function WriteFile. From the point of view of the framework, each call to WriteFile constitutes an IO.
File System Cache
The WriteFile call is processed by the kernel which has no intention of hitting the disk with everything user-mode application developers manage to come up with. So it buffers the framework’s data in the file system cache and spawns a background process to deal with it later. This so-called lazy writer evaluates the data in the cache and writes it to disk as it deems necessary. From the point of view of the lazy writer, each cache flush constitutes an IO.
File System Driver
Before the lazy writer’s data can be written to disk it must be processed by the file system driver (typically ntfs.sys). The driver might find it necessary to not only write the actual data to the disk but also to update the file system metadata, e.g. the master file table (MFT). When that happens the number of IOs required to store the data increases. Writing data to a file is not a simple each layer reduces the number of IOs by x percent type of scenario.
Disk
Now that we have reached the hardware level it is surely safe to assume that the IO is not manipulated any further, making this a good place to take measurements? Let’s see.
In the simplest case, the disk is a physical hard disk. But even with plain HDDs, there is yet another cache, and there is Native Command Queuing (NCQ, IO reordering to minimize head movements), both changing the IO on its way to permanent storage. So the only way to correctly measure IOPS would be on the disk platter. But what to measure? Head movements? What about SSDs, solid-state drives that thankfully do not have moving heads?
What about virtual disks? The device seen by the OS as a physical hard disk might not be physical at all. It could be a LUN in a SAN spread across many physical disks - yet another set of layers.
Measuring IOPS
I hope I could make the point that there is no such thing as the IO; neither can there be a single definition of IO throughput (aka IOPS). So how do we measure IOPS? How does our monitoring tool uberAgent for Splunk measure IOPS?
uberAgent for Splunk
uberAgent measures IOPS right before they are handed off from the operating system to device-specific drivers. In other words: the data it collects is as accurate as it can be without interfacing with the hardware directly.
The cool thing about what uberAgent does is that it is capable of mapping each IO to an originating process - and thus to a user, a session, and an application. As a result, uberAgent can show you how many IOs each of your applications generate. It can do the same for each user session, too, of course.
Conclusion
Measuring IOPS is harder than it may seem. It depends on many factors: the access pattern is very important, but so is the layer at which the measurement is taken. When you have decided how to do it and arrive at a number, you still do not have the single handle to disk performance. There are also throughput and latency to consider.
uberAgent for Splunk gives you the information you need to understand what is going on in your systems. No more, no less. Download and try it yourself.


Comments