Monitoring any Application's Startup Duration with uberAgent 1.6
- UberAgent
- Published Nov 26, 2013 Updated Mar 19, 2018
Application startup duration is an essential component of user experience. If you want to make sure that UX on your Windows machines is acceptable you need to monitor the time it takes for applications to start up. That, however, is not exactly easy - without uberAgent for Splunk.
What is Application Startup Duration?
Whenever you click an application’s icon, you wait. Sometimes a little, other times a lot. This is because applications need to perform all kinds of initializations before they are ready to show their UI and interact with the user. Additionally, all applications use additional logic outsourced into DLLs, most of which are loaded during application startup, too. Each of these DLLs is initialized in turn which adds a lot to the application’s overall startup duration.
Under the hood, applications consist of one or more processes. When you start an application, Windows creates a new process for you. But process creation is not limited to manual intervention; Windows runs dozens of services in the background, many of which regularly create child processes. These child processes need time to start up, too, of course. The longer that takes, the more sluggish the system feels.
Part of a process’s startup duration is spent waiting for the disk to read all these DLLs. In other words: process startup duration is heavily dependent on the machine’s IO performance. Therefore, when monitoring process startup duration, the generated IOPS should be kept in mind, too. If we have the IOPS in addition to the startup duration we can gauge the strain a process launch puts on the disk subsystem. We can also estimate how dependent a process’s startup performance is on disk speed.
How not to Monitor Application Startup Duration
Several vendors claim their products monitor application startup performance. In practice, it turns out many do not observe what is, but create their own alternate reality instead.
- One construct relies on regularly launching a specifically instrumented monitoring executable. This tells you something about the machine’s performance in general, but it does not tell you anything about the applications your users are running.
- Another approach is to simulate user behavior in real applications with scripts. This, too, tells you how the machines are performing you are running the script on. It is a good method for evaluating the effects of configuration changes on the performance of the entire system, but not more.
Monitoring Application Startup the uberAgent Way
What you really need to know is how those applications instances are performing that your users are actually running. You want to know things like the average startup duration - this is what most users are experiencing. You also want to know users and/or machines where startup duration is longer than the average. You might want to know how often individual applications are started. Finally you want to see the trend: is the user experience getting better or worse?
uberAgent gives you all of that. Without requiring application-specific configuration it shows you the duration of each single process start on any monitored computer. And the IOPS during the startup phase.
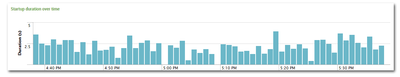
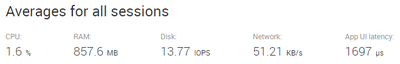
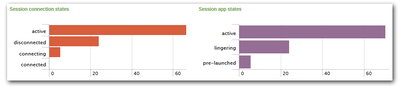
There is an overview panel:
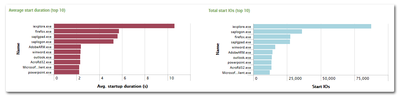
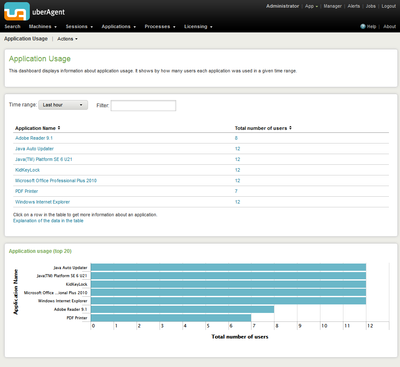
uberAgent shows you the processes that start up slowest and those generating the highest number of disk IOs:
There is as much detail as you want:
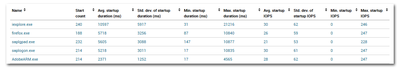
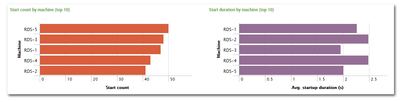
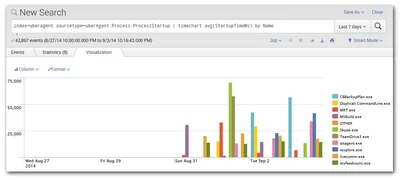
You get each process’s startup duration per computer…
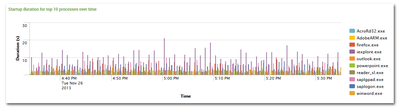
…and over time:


Comments