Race Condition - a Troubleshooting Tale
- Troubleshooting, UberAgent
- Published Feb 25, 2014 Updated Mar 18, 2018
The most obscure effects often have the simplest explanations - once you know where to go looking for them. Luckily uberAgent tells you exactly what is going on.
People often ask about the resource footprint of uberAgent. I usually tell them “no IO at all, around 15 MB RAM and below 0.5% CPU” and everybody is happy. Not this time, however.
Problem
The customer was running a PoC and found that uberAgent generated substantial IO (on average around 3 IOPS) and consumed an average of 0.7% CPU. Not a lot, but still enough to have me troubled. The customer also reported that the splash screen was not displayed at logon, even though they had not yet installed an evaluation license (which we are happy to send out, by the way).
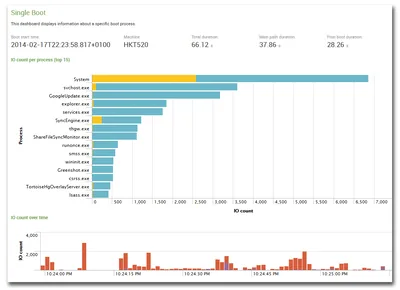
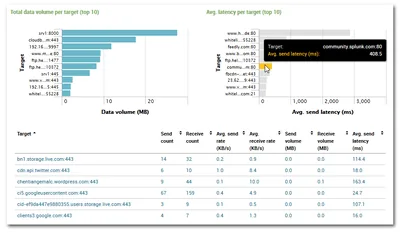
Finally they inquired why they were not seeing any boot duration data in the dashboards, i.e. this was missing:

Three seemingly unrelated problems. What was going on?
I asked for uberAgent’s log file - of which I am quite proud, I have to admit. It contains so much valuable information that you can use it to troubleshoot all kinds of problems and learn a lot about your applications along the way. But I am digressing.
Analysis
Searching the log file for warnings or errors I found nothing. Everything seemed to be all right. But when I browsed through the file I found a surprising number of startups. In a simplified way the file looked like this:
2014-02-24 15:34:13.272 +0100,======================================================================================
2014-02-24 15:34:13.272 +0100,Starting uberAgent.exe (1.8.0.0; 2014-02-06 16:44:36.000 +0100) on COMPUTERNAME
2014-02-24 15:34:13.272 +0100,======================================================================================
[... startup messages ...]
2014-02-24 15:34:21.135 +0100,Shutting down...
2014-02-24 15:34:21.228 +0100,...finished.
2014-02-24 15:34:22.039 +0100,======================================================================================
2014-02-24 15:34:22.039 +0100,Starting uberAgent.exe (1.8.0.0; 2014-02-06 16:44:36.000 +0100) on COMPUTERNAME
2014-02-24 15:34:22.039 +0100,======================================================================================
[... startup messages ...]
[... no shutdown message]
2014-02-24 15:35:20.867 +0100,======================================================================================
2014-02-24 15:35:20.867 +0100,Starting uberAgent.exe (1.8.0.0; 2014-02-06 16:44:36.000 +0100) on COMPUTERNAME
2014-02-24 15:35:20.867 +0100,======================================================================================
2014-02-24 15:35:27.372 +0100,Shutting down...
2014-02-24 15:35:27.591 +0100,...finished.

[... and so on ...]
Apparently, uberAgent was starting, shutting down, starting again, stopping without being properly shut down, starting again, and so on in an endless loop. That explained the relatively high CPU and IO load - the product generates a little bit of load during startup but is very tame after that. It also explains why the boot duration was missing: that data is collected five minutes after startup - uberAgent clearly did not run long enough for that to happen. And it also explained why no splash screen was displayed: again each process’ lifetime was not sufficient for that.
But why?
Race Condition
When uberAgent starts up it logs all running processes with their parameters. That includes its own parent process, a batch script that selects the correct binary for the system platform. Interestingly I found that parent process twice:
id=3876,parent=2068,cmdline=cmd /c ""C:\Program Files\SplunkUniversalForwarder\etc\apps\TA_uberAgent\bin\RunUberAgent.cmd""
id=6968,parent=2068,cmdline=cmd /c ""C:\Program Files\SplunkUniversalForwarder\etc\apps\TA_uberAgent\bin\RunUberAgent.cmd""
Both processes have the same parent (a process with the ID 2068, which, as the log also revealed, was Splunk’s Universal Forwarder, splunkd.exe). So uberAgent is started twice in close succession by Splunk. That explains what we had witnessed. uberAgent’s startup script RunUberAgent.cmd checks if uberAgent is running and sends a shutdown command. After a short wait period, it kills the running instance.
So what happened was this: the first instance comes up and runs through its initialization routine. While that happens the second instance is started. It finds the first and shuts it down. Then it starts its own initialization. Shutting down the first instance, however, is noticed by Splunk which restarts it. The respawned first instance detects another running instance (our second instance) and shuts it down. A classic race condition.
But why was Splunk starting uberAgent twice?
There was only one explanation: there had to be two copies of the relevant configuration file inputs.conf in different locations. Indeed that turned out to be the case. As soon as the duplicate entries had been removed, all the symptoms went away.
Final Thoughts
It took me longer to write up a report in an e-mail to the customer than to find out what was going on. I am a believer in great logfiles. Meaningful information from within an application is the fastest way from problem to resolution.


Comments