VictoriaMetrics: Long-Term Storage of Home Assistant Data
- Home Automation, Networking & Self-Hosting
- Published Mar 15, 2025 Updated May 3, 2025
This article explains how to set up VictoriaMetrics in a Docker container with automatic HTTPS via Caddy. It also shows how to forward Home Assistant data to VictoriaMetrics for long-term storage and how to query the data from Grafana. This post is part of my series on home automation, networking & self-hosting that shows how to install, configure, and run a home server & network with dockerized or virtualized services.
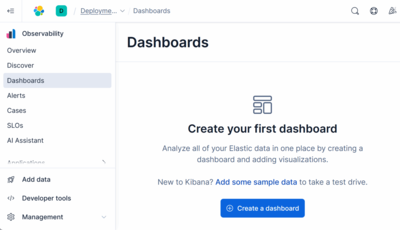
Note: If you’re looking for a more powerful (but also more complex) alternative to VictoriaMetrics for long-term storage of Home Assistant data, take a look at my article on Elasticsearch.

What is VictoriaMetrics?
VictoriaMetrics is an open-source time series database with an excellent free community plan. It is faster and much more lightweight than InfluxDB and Prometheus. As it comes with compatible data ingesting and/or querying APIs it can be used as a drop-in replacement for both products (and others, too). See this post from Dominik Britz for more information.
VictoriaMetrics Installation
Preparation
I’m assuming that you’ve set up Docker and the Caddy container as described in the previous articles in this series.
Dockerized VictoriaMetrics Directory Structure
This is what the directory structure will look like when we’re done:
rpool/
 └── encrypted/
     └── docker/
         └── victoriametrics/
             ├── data/
             ├── container-vars.env
             └── docker-compose.yml
We’re placing the configuration on the encrypted ZFS dataset (rpool/encrypted).
Create the new directories:
mkdir -p /rpool/encrypted/docker/victoriametrics/data
VictoriaMetrics Docker Compose File
We’re using the official VictoriaMetrics Docker image (but not the vendor’s sample Docker config). Create docker-compose.yml with the following content:
services:

  victoriametrics:
    container_name: victoriametrics
    hostname: victoriametrics
    image: victoriametrics/victoria-metrics
    restart: unless-stopped
    networks:
      - caddy_caddynet     # frontend communications
    ports:
      - 8428:8428          # web UI and data ingestion (HTTP)
    command:
      - "--retentionPeriod=100y"   # store data "indefinitely"
    volumes:
      - /etc/localtime:/etc/localtime:ro
      - ./data:/victoria-metrics-data

networks:
  caddy_caddynet:
    external: true
Start the VictoriaMetrics Container
Navigate into the directory with docker-compose.yml and run:
docker compose up -d
Inspect the container logs for errors with the command docker compose logs --tail 30 --timestamps.
Let’s Encrypt Certificate for VictoriaMetrics via Caddy
Caddyfile
Add the following to Caddyfile (details):
victoriametrics.{$MY_DOMAIN} {
	# Don't require authentication from the subnet Home Assistant is on (unauthenticated ingest)
	import auth not remote_ip 192.168.0.0/24
	reverse_proxy victoriametrics:8428
	tls {
		dns cloudflare {env.CLOUDFLARE_API_TOKEN}
	}
}
Notes:
- The definition of the
authsnippet can be found here. - Replace
192.168.0.0/24with the subnet your Home Assistant VM is on.
DNS A Record
Add the following A record to your DNS domain (details):
victoriametrics.home.yourdomain.com 192.168.0.4 # replace with your Docker host's IP address
Try to resolve the name on a machine in your network (e.g., nslookup victoriametrics.home.yourdomain.com).
Reload Caddy’s Configuration
Instruct Caddy to reload its configuration by running:
docker exec -w /etc/caddy caddy caddy reload
You should now be able to access the VictoriaMetrics web interface at https://victoriametrics.home.yourdomain.com without getting a certificate warning from your browser.
Send Data from Home Assistant to VictoriaMetrics
Home Assistant comes with an InfluxDB integration, and VictoriaMetrics is compatible with InfluxDB (sample config). This means that we can configure Home Assistant to send data to VictoriaMetrics.
Add the following to Home Assistant’s configuration.yaml:
influxdb: !include victoriametrics.yaml
Create victoriametrics.yaml in the same directory as configuration.yaml with the following content:
  api_version: 1
  host: victoriametrics.home.yourdomain.com
  port: 443
  ssl: true
  max_retries: 3
  measurement_attr: entity_id
  tags_attributes:
    - friendly_name
    - unit_of_measurement
  ignore_attributes:
    - icon
    - source
    - options
    - editable
    - min
    - max
    - step
    - mode
    - marker_type
    - preset_modes
    - supported_features
    - supported_color_modes
    - effect_list
    - attribution
    - assumed_state
    - state_open
    - state_closed
    - writable
    - stateExtra
    - event
    - friendly_name
    - device_class
    - state_class
    - ip_address
    - device_file
    - unit_of_measurement
    - unitOfMeasure
  include:
    domains:
      - sensor
      - binary_sensor
      - light
      - switch
      - cover
      - climate
      - input_boolean
      - input_select
      - number
      - lock
      - weather
  exclude:
    entity_globs:
      - sensor.clock*
      - sensor.date*
      - sensor.glances*
      - sensor.time*
      - sensor.uptime*
      - sensor.dwd_weather_warnings_*
      - weather.weatherstation
      - binary_sensor.*_smartphone_*
      - sensor.*_smartphone_*
      - sensor.adguard_home_*
      - binary_sensor.*_internet_access
Note: replace victoriametrics.home.yourdomain.com with the DNS name of your VictoriaMetrics instance.
Restart Home Assistant.
Verify the Home Assistant Data in VictoriaMetrics
To verify that Home Assistant data is indeed being ingested in VictoriaMetrics, open VictoriaMetrics’ simple web UI VMUI at https://victoriametrics.home.yourdomain.com/vmui, click Query and paste the following:
group by(__name__) ({__name__!=""})
You should see a list of metrics names, including, for example, weather.forecast_home_temperature.
Data Visualization in Grafana
If you followed my series on home automation, networking & self-hosting you should already have a dockerized Grafana instance. If not, now would be the right time to set one up (see my Grafana article for instructions).
VictoriaMetrics Data Source in Grafana
In Grafana, navigate to Menu > Connections > VictoriaMetrics. Install the VictoriaMetrics datasource plugin for Grafana. Once installed, click Add a new data source and specify the following settings:
- Name:
Victoriametrics - URL:
http://victoriametrics:8428(this connection uses the internal Docker network. It doesn’t go through Caddy.) - Click Save & test. You should get the message: Data source is working
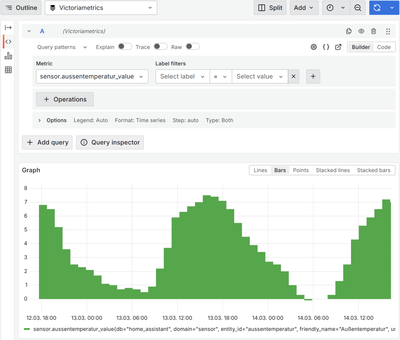
Create a Simple Query in Grafana
The following example shows how to create a simple query and explore the data sent from Home Assistant to VictoriaMetrics.
In Grafana, navigate to Menu > Explore and select Victoriametrics as your data source.
In the Metric dropdown you should see the Home Assistant sensors. Select one of the metrics from the list and click Run query. You should get a graph showing the sensor values over time. For the example below, I chose the outside temperature over the previous two days.


Comments