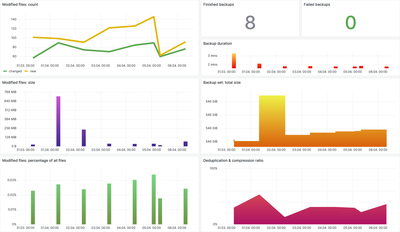
resticprofile Backup Monitoring Grafana Dashboard
- Home Automation, Networking & Self-Hosting
- Published Apr 6, 2024 Updated Sep 14, 2024
This article explains how to set up a Grafana dashboard to monitor restic/resticprofile backup operations. This post is part of my series on home automation, networking & self-hosting that shows how to install, configure, and run a home server with (dockerized or virtualized) services such as Home Assistant and ownCloud.
Overview
Requirements
This dashboard was built to monitor the backups on my home server. It was developed and tested with the setup described in my restic backup article but should work in other environments, too, as its only data source is the restic log file.
Data Collection Architecture
The data flow is as follows:
Backup log → Promtail → Loki → Grafana → dashboard
The backup log file is monitored by Promtail, which collects any new lines written and sends them to Loki. The dashboard is hosted by Grafana. Its charts are powered by LogQL queries which operate on the data stored in Loki.
Setting Up the Data Collection
Configuring Promtail to Collect resticprofile’s Backup Log File
Name of Docker Host as Grafana Label
We want to have the Docker host’s hostname as a label in Grafana. This, unfortunately, is more complex to achieve than it should be and consists of the following steps:
- Pass the host’s
/etc/hostnameinto the container as/etc/host_hostname. - Create a custom container entrypoint command that reads
/etc/host_hostnameand exports its value as the environment variableHOST_HOSTNAME. - In Promtail’s configuration, set the
hostlabel to theHOST_HOSTNAMEenvironment variable.
Promtail Docker Compose File
Since we want Promtail to collect the contents of the backup log, we mount that file into the container.
The Promtail Docker compose file docker-compose.yml now looks as follows:
  promtail:
    container_name: promtail
    hostname: promtail
    image: grafana/promtail:latest
    entrypoint: [ "/bin/sh","-c" ]
    command:
      - |
        export HOST_HOSTNAME=$$(cat /etc/host_hostname)
        /usr/bin/promtail -config.file=/etc/promtail/config.yml -config.expand-env=true
    restart: unless-stopped
    networks:
      - backend
    ports:
      - 1514:1514
    volumes:
      - /etc/localtime:/etc/localtime:ro
      - /etc/hostname:/etc/host_hostname:ro     # Pass the Docker host's hostname into the container
      - ./config/promtail:/etc/promtail:ro
      - ./data/promtail:/promtail
      - /rpool/encrypted/resticprofile/backup.log:/promtail/collect/resticprofile/backup.log:ro
    depends_on:
      - loki
Promtail Configuration
Add the following section to your Promtail configuration file config/promtail/config.yml to configure Promtail to collect and forward any lines written to the backup.log file:
scrape_configs:

  - job_name: resticprofile
    static_configs:
    - targets:
      - localhost
      labels:
        # Additional labels to be added to each event
        job: resticprofile
        host: ${HOST_HOSTNAME}       # Requires the command line parameter -config.expand-env=true
        # The path to load logs from. Can use glob patterns (e.g., /var/log/*.log).
        __path__: /promtail/collect/resticprofile/backup.log
Restart the Promtail Container
Navigate into the directory with docker-compose.yml and run:
docker compose down
docker compose up -d
Inspect the container logs for errors with the command docker compose logs --tail 100 --timestamps | grep promtail.
Inspecting the Backup Log in Grafana
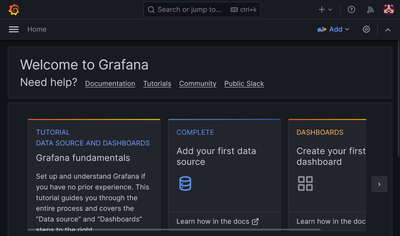
With the above changes in place, Promtail should already have collected the existing backup log and sent it to Loki. We can now query and inspect the data in Grafana by navigating to Home > Explore, switching from the query builder to Code in the upper-right corner, and running the following query:
{job="resticprofile"}
This should list each line from the backup log as an individual event prepended by a timestamp. When you expand an event by clicking the arrow to its left, you should see the labels/fields filename, host, and job.
Timestamp = Collection Time
Note how the timestamp is set to the time the data was collected by Promtail. I am not aware of any way to configure Promtail to use the log file’s last modification timestamp instead.
Importing the Grafana Dashboard
Save my restic backup Grafana dashboard to your local disk as a JSON file. In Grafana, navigate to Home > Dashboards, click New > Import, and upload the JSON file you saved in the previous step.
That’s it - you’re done. Enjoy!
Alternative Approach: Prometheus Instead of Loki
In the dashboard I used restic’s log file ingested in Loki as the data source. That has the advantage of listing the paths to the modified files. It’s also the natural approach for someone with a Splunk background.
However, it may be more efficient to rely on resticprofile’s backup summary metrics ingested in Prometheus instead. Here’s how to configure the data collection:
- Configure resticprofile to generate a
.promfile for Node Exporter to pick up as described here. - Configure Node Exporter to send the
.promfile to Prometheus as described here.
Verifying the Data Collection
In Prometheus, navigate to Graph and run the following query:
resticprofile_backup_status[1d]
This should display the backup status along with the timestamps when the .prom file was scraped by Node Exporter.
By the way: as you can see in the .prom file, a status of 2 stand for success, 1 for warning, and 0 for failure.


Comments