What’s New in uberAgent 3.0
One of the (many) great things about Splunk is that data, once indexed, is not being tampered with. Of course, you can choose for how long you want to retain your data, but Splunk won’t go and average multiple older events into one, because that would flatten peaks and remove potentially important detail.
This means that you do not have to evaluate incoming data immediately. You can do so when the need arises. Analyzing last month’s performance peaks? Easy. Comparing them to last year’s? No problemo.
One downside of this approach is that when searching over larger time spans huge numbers of events need to be processed. Depending on your Splunk server’s utilization this might have taken a while. Well, not any more!
Accelerated Data Model
With version 3.0, all of uberAgent’s dashboards are based on an accelerated data model. This speeds up dashboard load times by 50x-100x, especially when selecting longer time ranges.
So, what is an accelerated data model? You can think of it as an additional layer on top of the traditional Splunk index. And since it sits on top of the index instead of replacing it all existing dashboards and searches you may have in place continue to work (with very few exceptions – please consult the release notes). This new layer takes up some additional storage space, but it gives you speed, not only through uberAgent’s dashboards but also through Pivot.
Dashboard Functionality and Simple XML
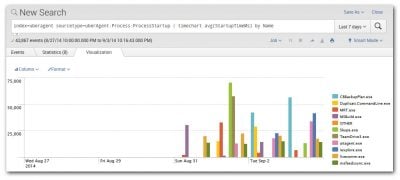
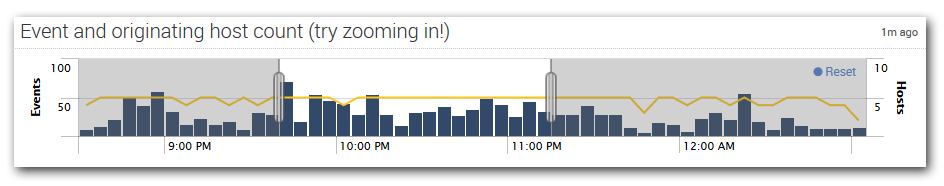
Not only have the searches used in uberAgent’s dashboards been ported to use the accelerated data model, we have rebuilt the entire dashboard UI, moving away from the legacy Advanced XML and embracing Splunk’s new Simple XML technology. This allowed us to significantly boost the functionality. Just take a look at this time range pan and zoom control that makes finding the right spot in any series of events a breeze:
You will also like the fact that the selected time range is now persisted when you drill down to another dashboard, that you can choose in many places which metric you want to be displayed in the charts and whether to calculate the average or rather some other statistical function like maximum, minimum, etc.
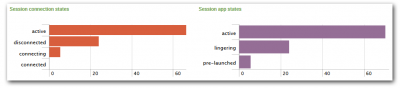
Inventory Data
uberAgent has been collecting application usage data for some time; now it also tells you what is sitting on disk in addition to being run in memory. uberAgent 3.0 collects inventory data for installed applications, updates (Microsoft security patches as well as other kinds of updates), and the operating systems it is running on.
Anonymization
Many European companies have work councils that are not always happy when detailed usage data is collected about the employees they represent. uberAgent 3.0 comes with a very effective way to deal with such concerns: user name encryption. This happens on the agent where data is collected, so real, unencrypted user names never leave the user’s machine. The encryption works in such a way that none of uberAgent’s features are impacted, e.g. application usage numbers, concurrent session counts or capacity planning data is still valid. The only thing that changes is that you cannot tell any more who the person actually was that logged off two hours early for weeks on end.
And More
There is a lot more new and improved stuff than this. Go try it for yourself; setting up uberAgent is super-fast and easy. Just make sure you have a current version of Splunk: all this new goodness requires at least Splunk 6.2.