Application Usage Metering with uberAgent for Splunk
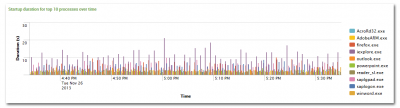
uberAgent has been pretty good at monitoring applications for some time. It is capable of auto-grouping processes to applications and showing IOPS and other stats per application in addition to per process. All this gets even better today: beta 2, available now, adds application usage metering to the feature list.
What is Application Usage Metering?
With uberAgent’s application usage metering you are able to answer annoying questions like these:
- We need to test our applications prior to the migration to the new OS. For starters, how many different applications do we have?
- We have got 140 licenses for product Z. Is that enough?
- We are ordering new servers for application A. We need 1 CPU per user – how many CPUs do we need in total?
In other words, application usage metering helps with resource planning, license compliance and sizing.
Resource Planning
Do you need to know how many applications you have? Do you need to compare usage numbers of applications or sort them according to popularity? uberAgent has the perfect dashboard for you:
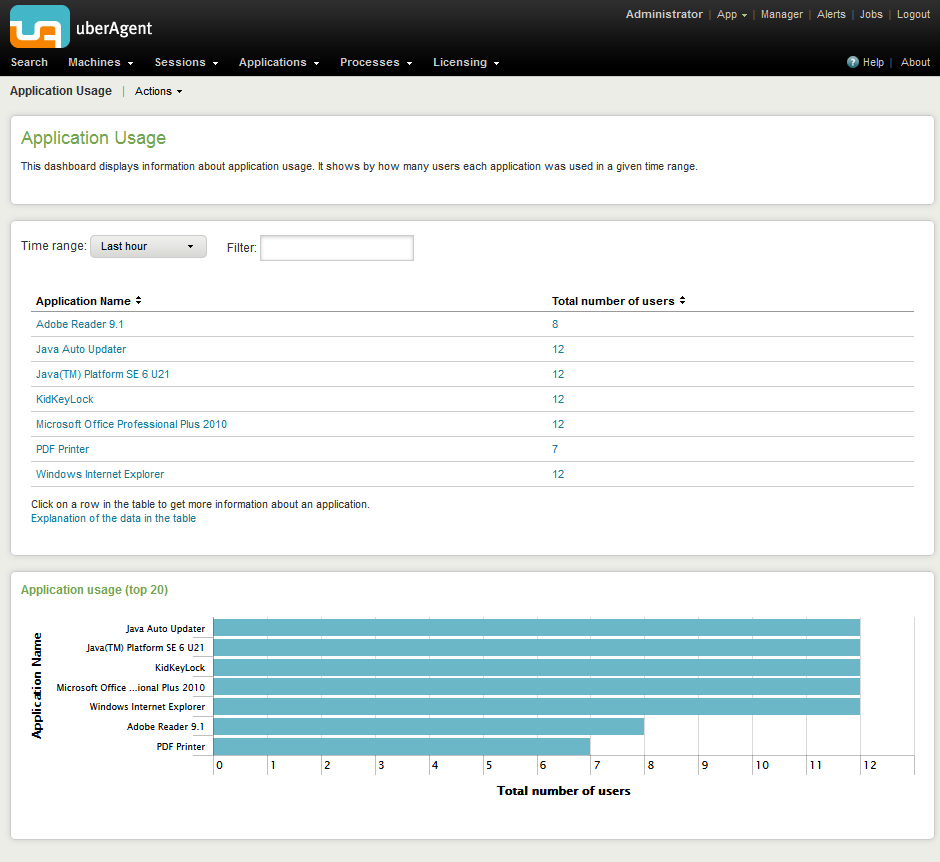
As always, the displayed time range can be chosen freely.
License Compliance and Sizing
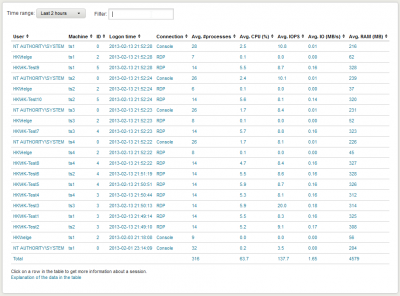
Whether you need to check if you have the right number of licenses for a specific application or want to plan a new deployment: it is often necessary to know application usage over a specific period of time. Nothing simpler than that. Just click any row in the table above and you will see a screen similar to this one:
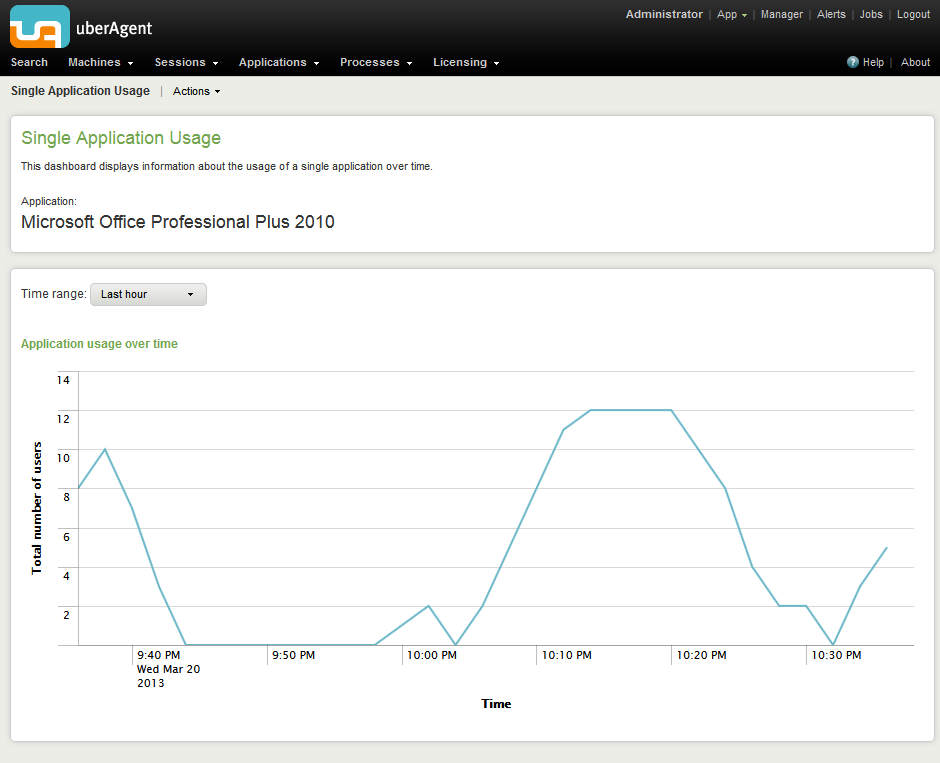
This tells you exactly what the maximum number of users of a specific application was and how often that was reached.