Introducing uberAgent for Splunk
uberAgent for Splunk takes Windows monitoring a step further. uberAgent does not just collect data – it gives you the information that matters. Other monitoring products rely on the performance counters built into Windows. uberAgent has its own metrics, covering key aspects of user experience and system performance.
Take logons: users are always complaining that logging on takes too much time. uberAgent not only tells you the exact duration of each single logon, it also shows you what is causing it: domain controller lookup, folder redirection group policy processing, logon script execution, to name a few.
Take performance: you keep buying servers and want to know where all that performance goes? Task Manager listing hundreds of processes does not help? uberAgent automatically groups processes to applications and gives you key indicators like IOPS or memory usage per application. Or per session. And if you absolutely insist: also per process.
All this data is not buried in a closed system, quite the contrary. As an add-on to Splunk, uberAgent gets to use all the capabilities of that great platform. And you get that, too: modifying or extending uberAgent is a snap with Splunk’s intuitive UI.
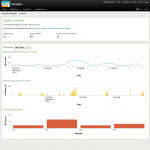
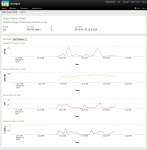
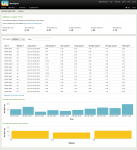
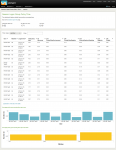
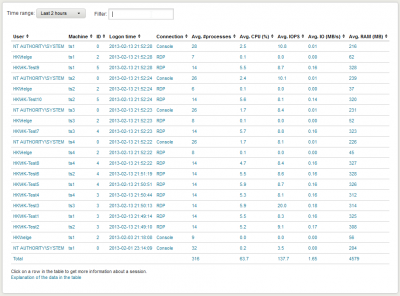
These first screenshots demonstrate what uberAgent is capable of in the area of user sessions. Whether it is logon times or IOPS per session, uberAgent has got you covered.
- Overview of user sessions and logon times.
- Detailed information about all user sessions.
- Performance information about a single session over time.
- Detailed information about logon times and performance.
- Adding to the logon information dashboard, this page displays granular group policy processing times.
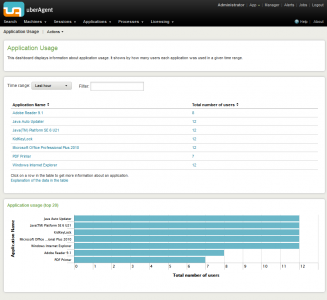
Screenshots of uberAgent’s application, machine and process dashboards are available in another article. If you like what you are seeing, register for the upcoming beta by sending e-mail to helge at helgeklein.com.
More information will be published soon in this blog and on uberAgent’s website.





8 Comments
We do not use SPLUNK. We have user logon issues in our XA65/Win2k8R2 though and would be great to be able to get some information into why our users are experiencing slow logons. Is it possible to get information out of uberAgent ‘standalone’ (without SPLUNK)?
Thanks, Brian
uberAgent only works with Splunk. Stay tuned, though, we might have something interesting for you in the future.
Hi
How far into the future are you talking ?
Regards
Gary
Gary,
currently there are no plans for decoupling uberAgent from Splunk.
I would like to find out how long uberAgent for Splunk will work. I have downloaded it with Splunk , do I need to purchase a license to continue using it?
Hi Teresa,
without a license uberAgent displays a splash screen during logon. We would be happy to send you a two-month evaluation license. Please send an e-mail to info at helgeklein.com with the following information:
– Company name
– DNS name(s) of AD domain(s)
– Where do you want to run uberAgent: server or client
Thanks!
Can the agent run on Windows 7 64-bit systems?
Yes, of course. You can find the full system requirements here.