Application Network Connection Monitoring With Splunk & uberAgent
- Networking, Security
- Published Feb 16, 2021 Updated Mar 27, 2021
This is part 1 of my application network connection monitoring series, a group of articles that explain how to analyze the network traffic of any Windows or macOS app. The communication targets of the Windows OS and of many popular apps are listed in dedicated posts.
The series consists of the following articles:
- Part 1 (this article): explanation of the methodology
- Part 2: list of MS Office & Teams communication targets
- Part 3: list of Windows, OS services & UWP apps communication targets
- Part 4: list of Citrix CVAD communication targets
- Part 5: list of Adobe Acrobat Reader, Photoshop, & Creative Cloud communication targets
Why Monitor Application Network Connections?
Security analysts want to know who their organization’s applications are talking to. They need to know which ports are involved, which internet hosts are contacted, and even which IP addresses are accessed. They use monitoring and analytics tools to detect a wide range of IT security issues, including data exfiltration, targeted attacks, unwanted telemetry, and marketing trackers.
 by John K Thorne under [CC](https://creativecommons.org/licenses/by-sa/2.0/)")
Where to Put the Observation Post?
There are two different places where network traffic can be observed: on the endpoint or on a network device.
Monitoring Network Traffic on the Endpoint
There is one huge benefit to monitoring network communications on the machine where the sending or receiving application is running: each network packet can be attributed to the originating application. This makes a lot of contextual information available, e.g., application versions, or user names. You can see which SKU of Windows 10 is talking to Microsoft’s telemetry servers. You can check if it is a PowerShell script that is downloading binaries from an unknown host. And you can verify that no elevated processes communicate with internet hosts, to name some examples.
Monitoring Network Traffic on a Network Device
When monitoring network traffic on a firewall or router, only very little information about the traffic’s originator is available. Finding out process names, application versions or user accounts is next to impossible. On the upside, the monitoring tool is independent of the machines that are monitored, therefore the risk of compromise is lower.
How to Monitor Application Network Connections?
Packet Monitoring vs. Connection Monitoring
If you’re interested in what happens on the packet level, a capturing tool like Wireshark is right for you. If, on the other hand, you want to know what happens at the application level, take a look at our uberAgent product. It does not capture packets but monitors application network connections. For every connection, uberAgent determines key metrics like latency, jitter, transfer volume, and network errors. The collected data is enriched with contextual metadata and sent to Splunk, where a powerful query language facilitates analyses across thousands of endpoints.
Getting Started With Free Licenses
Both uberAgent and Splunk come with free licenses for consultants and smaller environments. To get Splunk Free, simply download Splunk Enterprise. It can be used perpetually with a 500 MB limit on new daily data volume.
If you haven’t used uberAgent before, take a look at this quickstart guide. You only need uberAgent on a single endpoint in order to reproduce what I’m explaining here. As for Splunk, it runs more or less anywhere. You can even install it on the same machine as uberAgent.
Generating an Application Network Target Host Report
Basic Search
We’re going to build a Splunk search that can be used as a basis for a comprehensive report. If you’ve used Splunk before, the pivot command may seem unfamiliar. The reason we’re using it is that uberAgent comes with an accelerated data model that requires the use of pivot (or tstats) as first search command.
We’re starting the search with a query of uberAgent’s NetworkTargetPerformance sourcetype/dataset:
| pivot `uA_DM_Process_NetworkTargetPerformance` Process_NetworkTargetPerformance
   values(ProcName) as ProcNames
   values(AppVersion) as AppVersions
   values(NetTargetRemoteName) as NetTargetRemoteName
   values(host) as Hosts
   splitrow
      AppName
   splitrow
      NetTargetRemoteAddress
   splitrow
      NetTargetRemotePort
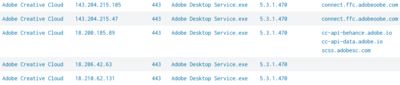
This gives us one row per unique combination of originating application name (AppName), remote IP address (NetTargetRemoteAddress) and remote TCP port (NetTargetRemotePort). For each such row, we’re asking Splunk to create additional fields with the process names (ProcName), application versions (AppVersion), source hosts (host) and remote DNS hostnames (NetTargetRemoteName). The result looks promising:
Search Refinement
As you can see above, we have multiple rows for a single application. In the next step we’re going to combine all unique network target names in one field. We don’t do the same for the IP addresses (although it would be possible), counting the number of unique addresses instead. Let’s append the following to the search:
| mvexpand NetTargetRemoteName
| rename AppName as Application
| eval NetTargetRemoteNamePort = NetTargetRemoteName . ":" . NetTargetRemotePort
| stats
   values(AppVersions) as "App version(s)"
   values(ProcNames) as "Process(es)"
   dc(NetTargetRemoteAddress) as "#Target IPs"
   values(NetTargetRemoteNamePort) as "Targets"
   by Application
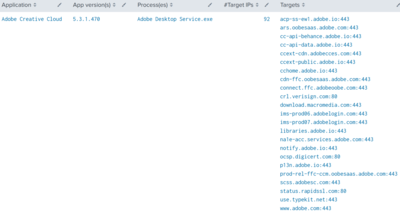
The result is a single row per application:
The Completed Search
The search we created in the first two steps above works well, but it includes network connections to internal networks as well as internet-facing communications. We’re going to clean the results by filtering out connections to internal IP segments. We’re also filtering data from browsers because we’re not interested in web apps at this point. Filters can be modified easily, of course. The completed search looks like this:
| pivot `uA_DM_Process_NetworkTargetPerformance` Process_NetworkTargetPerformance
   values(ProcName) as ProcNames
   values(AppVersion) as AppVersions
   values(NetTargetRemoteName) as NetTargetRemoteName
   values(host) as Hosts
   splitrow
      AppName
   splitrow
      NetTargetRemoteAddress
   splitrow
      NetTargetRemotePort
   filter
      NetTargetRemoteAddress isNot "10.*"
   filter
      NetTargetRemoteAddress isNot "172.16.*"
   filter
      NetTargetRemoteAddress isNot "192.168.*"
   filter
      NetTargetRemoteAddress isNot "169.254.*"
   filter
      NetTargetRemoteAddress isNot "0.0.0.*"
   filter
      NetTargetRemoteAddress isNot "255.255.*"
   filter
      NetTargetRemoteAddress isNot "224.0.0.*"
   filter
      NetTargetRemoteAddress isNot "fc00:*"
   filter
      NetTargetRemoteAddress isNot "fd00:*"
   filter
      NetTargetRemoteAddress isNot "ff00:*"
   filter
      NetTargetRemoteAddress isNot "ff01:*"
   filter
      NetTargetRemoteAddress isNot "ff02:*"
   filter
      NetTargetRemoteAddress isNot "ff05:*"
   filter
      NetTargetRemoteAddress isNot "fe80:*"
   filter
      NetTargetRemoteName isNot "wpad"
   filter
      NetTargetRemoteName isNot "*fritz.box"
   filter
      NetTargetRemoteName isNot "*.mshome.net"
   filter
      NetTargetRemoteName isNot "*vastlimits*"
   filter
      AppName isNot "Google Chrome"
   filter
      AppName isNot "Firefox"
   filter
      AppName isNot "Microsoft Edge"
   filter
      AppName isNot "Internet Explorer"
   filter
      AppName isNot "Remotedesktopdienste"
   filter
      AppName isNot "Remote Desktop Services"
   filter
      AppName isNot "SoftEther VPN"
   filter
      AppName isNot "Killer Network Service"
   filter
      ProcName isNot "powershell.exe"
   filter
      NetTargetRemoteName is *
| mvexpand NetTargetRemoteName
| rename AppName as Application
| eval NetTargetRemoteNamePort = NetTargetRemoteName . ":" . NetTargetRemotePort
| stats
   values(AppVersions) as "App version(s)"
   values(ProcNames) as "Process(es)"
   dc(NetTargetRemoteAddress) as "#Target IPs"
   values(NetTargetRemoteNamePort) as "Targets"
   by Application
Summary
In this article, I have shown how to build a Splunk search that generates an application network connection target report, i.e., a list that shows which internet hosts your applications are talking to. I’ll use this search to generate such reports for common applications like Microsoft Office, Teams, and also the Windows 10 operating system itself. Stay tuned.


Comments