XenApp and RDS Sizing Part 2 – Determining Farm Capacity
This article is part of a mini-series. You can find the other articles here.
As we have seen in part 1 of this series, when sizing a new farm the first thing we need to know is the capacity of the existing farm. Armed with data on capacity and additionally load, we can easily calculate the capacity of a new farm. In this article I describe how to determine capacity of the four relevant hardware components of a XenApp server: CPU, memory, storage and network.
CPU Capacity
If you only have one CPU model, determining the total CPU capacity is simple: just add up the total number of cores. But what if you have different models? How do you add the performance of, say, a Xeon 7100 and a Xeon E5640? Simply adding Gigahertz values does not cut it; modern CPUs are more efficient per Herz than older ones.
Normalization
You can add numbers from two different systems only after you normalize them, i.e. make them comparable. One method of making CPUs comparable is to run benchmarks. I did not want to do that, though. Way too cumbersome. There had to be a more elegant solution. And there is.
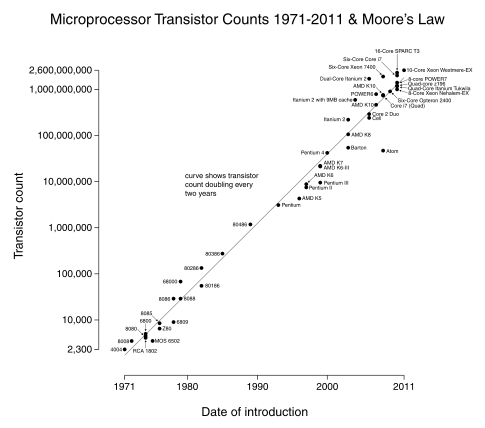
Moore’s law states that the number of transistors – and thus performance – doubles every 18-24 months. That gives us a simple way to calculate the relative performance of two processors. The only things we need to know are the CPUs’ release dates. Easy enough. But wait! How can Moore’s law be universally true? It is nothing more than one man’s prediction dating back to 1965!
It can easily be shown that Moore’s law is true, at least has been for the past 40 years:
As to the why: Reality conforming to Gordon Moore’s prediction would be entirely by chance if many of the important players in the semiconductor industry had not started to use his law to time their product releases, making Moore’s law a self-fulfilling prophecy.
Calculating with Gordon Moore
Adapted to our situation Moore’s law states:
CPU B is twice as fast as CPU A if B was released 18-24 months after A and both CPUs are from the same price segment.
As a formula, it looks like this:

In words: the performance of CPU B, released t months after CPU A, is equal to (e to the power of 0.033 times t) times the performance of CPU A.
Normalized CPU Cores
When applying above formula to a typical set of server CPUs we get the following table:
| CPU | Cores | First sold | Perf index | Perf index per core |
| Xeon 7100 3.0 GHz | 2 | 08/2006 | 2.0 | 1.0 |
| Xeon 7100 3.4 GHz | 2 | 03/2007 | 2.52 | 1.26 |
| Xeon E5440 | 4 | 11/2007 | 3.28 | 0.82 |
| Xeon X5550 | 4 | 03/2009 | 5.56 | 1.40 |
| Xeon E5640 | 4 | 03/2010 | 8.26 | 2.06 |
As you can see, we set the oldest CPU’s performance index per core to 1.0. Moore’s law gives us performance indices for other CPUs.
By calculating the performance index per CPU core we normalized CPU performance values. As a result, we can now directly add the (normalized) performance values of different CPU models. In our example, with 10 Xeon 7100 3.0 GHz, 16 Xeon 7100 3.4 GHz, 6 Xeon E5440, 8 Xeon X5550 and 6 Xeon 5640, the table looks like this:
| CPU | Number of CPUs | Number of cores | Perf index per core | Number of normalized cores |
| Xeon 7100 3.0 GHz | 10 | 20 | 1.0 | 20 |
| Xeon 7100 3.4 GHz | 16 | 32 | 1.26 | 40.3 |
| Xeon E5440 | 6 | 24 | 0.82 | 19.7 |
| Xeon X5550 | 8 | 32 | 1.4 | 44.8 |
| Xeon E5640 | 6 | 24 | 2.06 | 49.4 |
| Total | 44 | 126 | – | 174.2 |
Memory Capacity
Determining RAM capacity is easier than determining CPU capacity because we can simply add RAM values from different servers. Different speeds (DDR, DDR2, DDR3, etc.) do not matter in practice. However, there is one thing that makes this a little more interesting: we need the amount of free RAM. Only RAM that is available for user sessions is relevant for farm capacity. Calculate it like this:
![]()
with:
- RAMinstalled: Physical RAM in the server
- RAMinvisible: Memory that cannot be accessed by the operating system
- RAMOS: Memory used by the OS
Physical RAM installed in the server can be invisible to the OS for several reasons, technical as well as licensing. Especially on 32-bit platforms a relatively large part of the 4 GB address space is needed for device drivers to communicate with the hardware. The following table illustrates this for several generations of popular HP servers:
| Server model | Invisible RAM | Percentage lost (out of 4 GB total) |
| DL360 G4 | 0.5 GB | 12.5% |
| DL360 G5 | 0.75 GB | 18.75% |
| DL360 G6 | 0.51 GB | 12.8% |
| DL360 G7 | 0.51 GB | 12.8% |
The amount of memory used by the OS should really be called memory used by the platform because it includes add-on software components like Citrix XenApp, antivirus, user environment management and so on. In short: everything that not directly belongs to a user session. Here are some values I compiled for Server 2003 and 2008 R2 (your mileage can – and will – vary):
| Description | Server 2003 x86 | Server 2008 R2 x64 |
| Kernel | 175 MB | 300 MB |
| Session 0 (OS + XA + AV) | 325 MB | 600 MB |
| File system cache | 400 MB | 500 MB |
| Total | 900 MB | 1,400 MB |
File system cache is very important. If it gets too small performance goes down, response times go up.
Did you ever notice how much memory you wasted with yesterday’s 4 GB 32-bit servers? Out of the 3,5 GB that were actually usable, more than 25% was required by the OS alone. Less than 75% of all RAM could be used for its main purpose, hosting user sessions!
Continuing our example from above, we calculate total memory capacity for our 23 server farm as follows:
| Server model | Number of systems | Free RAM per W2k3 server | Free RAM (sum) |
| DL360 G4 | 13 | 2,684 MB | 34,892 MB |
| DL360 G5 | 3 | 2,428 MB | 7,284 MB |
| DL360 G6 | 4 | 2,674 MB | 10,696 MB |
| DL360 G7 | 3 | 2,674 MB | 8,022 MB |
| Total | 23 | – | 60,894 MB |
Storage Performance
I deliberately do not use the term capacity with storage lest people only think in terms of size. Much more relevant for multi-user systems with hundreds of concurrent processes each depending on mass storage is throughput – no, not how many bytes per second the storage system can read or write, but how many different IO operations it can process per second. IOPS is by far the most important storage metric in our field of work, and for that reason I used it to characterize a farm’s storage performance.
How do we determine the total number of IOPS an existing farm can process? Although we can simply add IOPS values from different hard drives we still need the numbers for each type of drive. Unfortunately measuring IOPS is not easy because the result greatly depends on how you measure (transfer request size, queue depth, random vs. sequential, read vs. write). Luckily we are bound to find traditional spinning disks in the servers of older farms (and probably also in most new farm servers) whose IOPS values depend mainly on rotational speed. Ballpark numbers that are good enough for our purpose can be found in Wikipedia:
| Device | IOPS |
| 7,200 rpm SATA HDD | 75-100 |
| 10,000 rpm SATA HDD | 125-150 |
| 10,000 rpm SAS HDD | 140 |
| 15,000 rpm SAS HDD | 175-210 |
With this data total IOPS calculation becomes dead simple. Continuing our example, we probably have 15 K disks even in older G4 servers, each equipped with 2 disks configured as RAID-1 mirrors. Since only one disk is active in a two-disk mirror we use only one disk per server in our calculation. With an average value per disk of 190 IOPS we get:
Total IOPS per farm = 23 * 190 = 4,370
Notice how small this number is compared to SSDs? Even a cheap consumer SSD easily outperforms those 23 active server hard disks by a factor of two – and that is in the more difficult discipline of writing data.
Network Capacity
For our purposes network capacity is equal to throughput in bytes per second. The XenApp servers in our example are equipped with one active gigabit network connection. Gigabit ethernet is capable of transferring roughly 100 MB/s.
Total network capacity: 23 * 100 MB/s = 2,25 GB/s
Being able to transfer 2,25 Gigabytes per second is pretty impressive and very probably this is much more than we need for XenApp.
Capacity per User
Server capacity values are certainly nice to have, but what we really need are values per user. Continuing with our example, our 23-server farm was designed for a maximum of 250 concurrent users. That is also the number of Citrix XenApp licenses the customer purchased. Farm capacity per user can be calculated by dividing total farm capacity by the user count:
| Component | Farm capacity | Capacity per user |
| CPU | 174.2 norm. cores | 0.7 norm. cores |
| Memory | 60,894 MB | 244 MB |
| Storage | 4,370 IOPS | 18 IOPS |
| Network | 2,300 MB/s | 9.2 MB/s |
Preview
In this article I have shown how to assess the computing power you have in your datacenter. The next article will be about determining how that hardware is used, in other words: determining the load.


2 Comments
Mind.Blown();
But really, using Moore’s law to normalize cpu performance seems too good to be true…
Have you done anything to verify the results? Can transistors count be used as a sole measure to gauge performance?
What about L2/L3 Cache sizes, IPC, NUMA architecture, HT, SSEx, etc…?
And also not forgetting about Chipset architecture, Memroy throughput, Timings and such.
I suspect it’s not accurate and probably varies depending on types of load but perhaps just good enough :)
In any case – thank you so much for such a brilliant series.
Using Moore’s law is certainly not accurate, but it is simple to use and – I hope – good enough for this purpose.