Troubleshooting Splunk Error “Search Process Did Not Exit Cleanly”
When Splunk displays an orange warning triangle instead of a chart or table it is time to investigate. Start by clicking the triangle to bring up a dialog with the error message. In my case that looked like this:
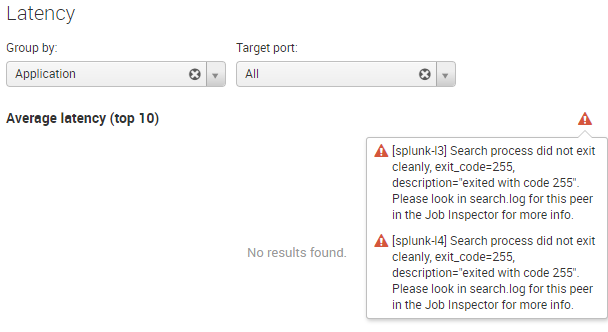
Search process did not exit cleanly, exit_code=255
Finding the Root Cause
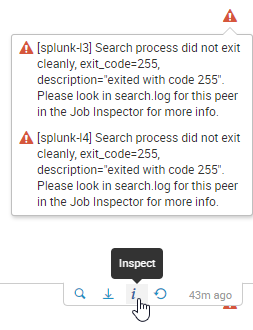
In many cases, the best resource for troubleshooting Splunk searches is Search job inspector. You can open it by clicking the i icon below a chart:
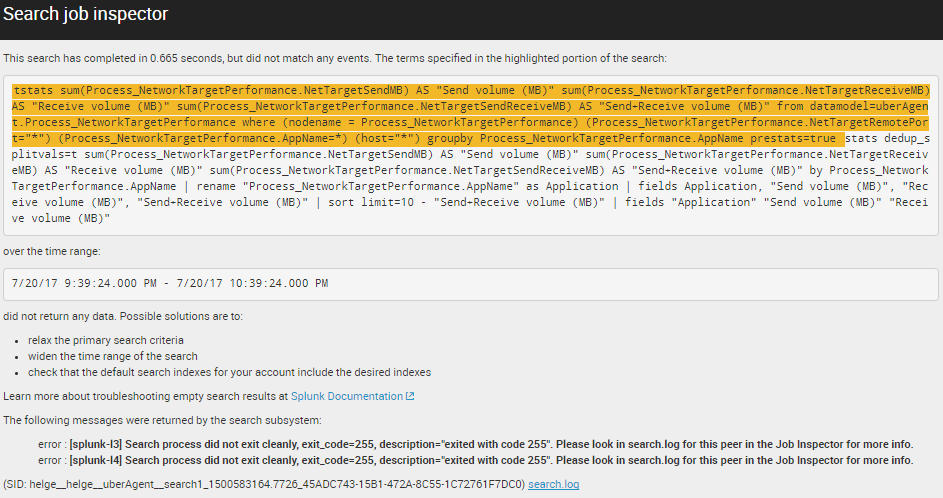
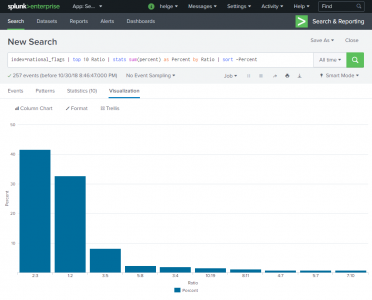
This opens Search job inspector in a new browser tab. The top of the page summarizes search properties and lists the errors that have occurred:
Sometimes that is all you need. Not in this case, though. We have a distributed deployment with search head and indexer clusters. In such a scenario it is not always trivial to get to the right log file from the right machine.
Scroll to the bottom of the page and expand Search job properties. Scroll down once more. The last row has what we need: links to the relevant search logs on the indexers:
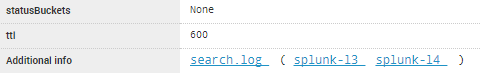
As you saw above we got the same error on both our indexers splunk-l3 and splunk-l4. We’ll just look at splunk-l3 for now by clicking the link in the additional info row in search job inspector. This is what we get:
07-20-2017 22:39:24.810 INFO  dispatchRunner - Search process mode: preforked (reused process)
07-20-2017 22:39:24.811 INFO  dispatchRunner - registering build time modules, count=1
07-20-2017 22:39:24.811 INFO  dispatchRunner - registering search time components of build time module name=vix
07-20-2017 22:39:24.812 INFO  BundlesSetup - Setup stats for /opt/splunk/var/run/searchpeers/13A7F4FB-8087-49CF-9097-2497E1AB27B3-1500582939: wallclock_elapsed_msec=67, cpu_time_used=0.0360000, shared_services_generation=2, shared_services_population=1
07-20-2017 22:39:24.812 INFO  UserManager - Setting user context: splunk-system-user
07-20-2017 22:39:24.812 INFO  UserManager - Done setting user context: NULL -> splunk-system-user
07-20-2017 22:39:24.812 INFO  UserManager - Unwound user context: splunk-system-user -> NULL
07-20-2017 22:39:24.812 INFO  UserManager - Setting user context: helge
07-20-2017 22:39:24.812 INFO  UserManager - Done setting user context: NULL -> helge
07-20-2017 22:39:24.814 INFO  dispatchRunner - search context: user="helge", app="uberAgent", bs-pathname="/opt/splunk/var/run/searchpeers/13A7F4FB-8087-49CF-9097-2497E1AB27B3-1500582939"
07-20-2017 22:39:24.814 INFO  SearchParser - PARSING: tstats  sum(Process_NetworkTargetPerformance.NetTargetSendMB) AS "Send volume (MB)" sum(Process_NetworkTargetPerformance.NetTargetReceiveMB) AS "Receive volume (MB)" sum(Process_NetworkTargetPerformance.NetTargetSendReceiveMB) AS "Send+Receive volume (MB)"  from datamodel=uberAgent.Process_NetworkTargetPerformance where (nodename = Process_NetworkTargetPerformance) (Process_NetworkTargetPerformance.NetTargetRemotePort="*")  (Process_NetworkTargetPerformance.AppName=*)  (host="*")  groupby Process_NetworkTargetPerformance.AppName  prestats=true  | addinfo  type=count label=prereport_events | fields  keepcolorder=t "Process_NetworkTargetPerformance.AppName" "Process_NetworkTargetPerformance.NetTargetReceiveMB" "Process_NetworkTargetPerformance.NetTargetSendMB" "Process_NetworkTargetPerformance.NetTargetSendReceiveMB" "prestats_reserved_*" "psrsvd_*" | prestats  dedup_splitvals=t sum("Process_NetworkTargetPerformance.NetTargetReceiveMB") sum("Process_NetworkTargetPerformance.NetTargetSendMB") sum("Process_NetworkTargetPerformance.NetTargetSendReceiveMB") by "Process_NetworkTargetPerformance.AppName"
07-20-2017 22:39:24.873 INFO  UserManager - Unwound user context: helge -> NULL
07-20-2017 22:39:24.874 ERROR dispatchRunner - RunDispatch::runDispatchThread threw error: Comparator '=' has an invalid term on the right hand side: NetTargetSendLatencyMs*NetTargetSendLatencyCount
Bingo! The last row has an error message pointing to a problem with the expression NetTargetSendLatencyMs*NetTargetSendLatencyCount. At last we know what’s wrong.
Fixing the Error
The search is against a data model, so let’s look for the problematic expression NetTargetSendLatencyMs*NetTargetSendLatencyCount in the app’s data model JSON file, located in the app subdirectory default/data/models. The expression is used in a field calculated by the following eval expression:
(NetTargetSendLatencyMs*NetTargetSendLatencyCount)Exactly what Splunk was complaining about. Apparently Splunk has recently become a bit finicky when fields are NULL in calculations. Let’s replace the expression with something a bit safer:
if (isnotnull (NetTargetSendLatencyMs), if (isnotnull (NetTargetSendLatencyCount), NetTargetSendLatencyMs*NetTargetSendLatencyCount, null()), null())And that’s it. Happy splunking!


2 Comments
Hi Helge Klein,
I have got same trouble when installed Splunk App for Web Analytics in cluster enviroment ( 1SH , 1 Master Node , 2 PN). When tried to search on any tab of Search Head we got error message ” 08-10-2017 09:53:15.881 ERROR dispatchRunner – RunDispatch::runDispatchThread threw error: Comparator ‘=’ has an invalid term on the right hand side: 1+1″
but when i tried to search on two Indexer everything’s ok
Could you help me resolve it, Thanks
Thanks, this helped me find my issue. posted up two search logs side by side in notepad++ was very helpful to compare the broken component on my search pipeline. mine was related to AUTH processing having some kind of seizure when trying or execute the job on one indexer. it eventually self resolved, time for a rebuild.