Elasticsearch: Long-Term Storage of Home Assistant Data
- Home Automation, Networking & Self-Hosting
- Published May 3, 2025
This article describes how to send Home Assistant metrics to Elasticsearch for long-term storage and visualization. It focuses on the integration between the two products and on how to configure Elasticsearch. This post is part of my series on home automation, networking & self-hosting that shows how to install, configure, and run a home server & network with dockerized or virtualized services.
Note: If you’re looking for a simpler alternative to Elasticsearch for long-term storage of Home Assistant data, take a look at my article on VictoriaMetrics.
Prerequisites
I’m assuming that you’ve set up Home Assistant and Elasticsearch as described in the previous articles on this site.
Add Label to HA Entities to be Sent to Elasticsearch
We want to set up an efficient configuration that minimizes storage requirements. Home Assistant processes and collects a lot of data, most of which is not needed in Elasticsearch. We’ll, therefore, add a label to those entities we want to sent to Elasticsearch for long-term storage.
In Home Assistant, press c to bring up the quick bar, navigate to Entities, select the entities to be sent to Elasticsearch, click Add label in the upper-right corner, and create a label with the following settings:
- Name: Long-term-storage
- Icon:
mdi:database - Color: choose any color
- Description: Only entities with this label are sent to long-term storage (i.e., Elasticsearch).
Elasticsearch Component for Home Assistant
This is the integration component that links Home Assistant to Elasticsearch.
Download
Install Elasticsearch Component for Home Assistant via HACS as documented:
- In Home Assistant, navigate to HACS, search for Elasticsearch and download version 2.x of the integration.
- Restart Home Assistant.
Installation
In Home Assistant, press c to bring up the quick bar, navigate to Integrations, click Add integration, select Elasticsearch and specify the following settings:
- URL:
https://elastic1.home.yourdomain.com
Configuration
Once the Elasticsearch integration is installed, you’re on a screen that shows your integration entry - the one that points to https://elastic1.home.yourdomain.com. Click Configure to bring up the Elastic integration settings dialog and select the following:
- Send events to Elasticsearch at this interval: 60 s
- Gather all entity states at this interval: 60 s
- Choose what types of entity changes to listen for and publish:
- Track entities with state changes: disabled
- Track entities with attribute changes: disabled
- Toggle to only publish the set of targets below:
- Label:
Long-term-storage
- Label:
Note: If you’re interested in keeping track of state changes in Elasticsearch (e.g., a lamp was switched on or off), enable the two related checkboxes.
Elasticsearch Index & Data Stream Configuration
To manage indices and related items navigate to Kibana > Management > Data > Index management.
Show Home Assistant Indices
Looking at the Indices tab, you won’t see any. This is because hidden indices are not displayed by default. To change that, flip the toggle in the upper-right corner. Then, filter for home to display the indices created by the Home Assistant integration.
Data Stream & Index Health Is Yellow
You’ll notice that the Home Assistant indices have a health setting of yellow. The same applies to the Home Assistant data streams. The reason is that the default required number of replicas is 1, meaning that an index is to be stored on at least one additional Elasticsearch node. As we only have a single node, we’ll need to change that from 1 to 0. And we need to do that in two places: by creating a component template for new indices, and by modifying the properties of the already created indices.
Create a Component Template to Set the Replica Number for New Indices
A component template applies settings via its linked index template to new indices.
To create a new component template, navigate to Index templates > metrics-homeassistant > edit > Component templates > metrics-homeassistant@custom > create component template and specify the following settings for the new component template:
- Index settings tab:
- Add:
"number_of_replicas": 0
- Add:
Modify the Replica Number of Existing Indices
In the left navigation bar, go to Management > Dev tools. On the Console > Shell tab, paste the following command:
GET .ds-metrics-homeassistant.*/_settings/
Press Ctrl + Enter to execute the command. The output window populates with the resulting settings for all Home Assistant indices. You’ll notice that each index’s replica setting is "number_of_replicas": "1".
To set the number replicas to 0 for each Home Assistant index, execute the following command:
PUT .ds-metrics-homeassistant.*/_settings
{
  "index" : {
    "number_of_replicas" : 0
  }
}
Data Stream Data Retention
Data retention is managed on the data stream level. Changing the data retention is, as above, a two-step operation:
- changing the index template for new data streams, and
- changing the properties of the existing data streams.
Change Data Retention for New Data Streams via the Index Template
To change the data retention for new data streams, navigate to Index templates > metrics-homeassistant > edit > Logistics and set Data retention to the desired value, in our case to Keep data indefinitely.
Change Data Retention for Existing Data Streams
We’ll start by retrieving the current data stream settings. In the left navigation bar, go to Management > Dev tools. On the Console > Shell tabs, paste the following command:
GET _data_stream/metrics-homeassistant.*/_lifecycle
To set each Home Assistant data stream’s retention to infinite, execute the following command (docs):
PUT _data_stream/metrics-homeassistant.*/_lifecycle
{}
Info: Index Rollover
Elasticsearch writes to a data stream index until certain rollover conditions are met. When that is the case, a new index is created. The details are documented here. To summarize and quote from the docs for cluster.lifecycle.default.rollover, a data stream will rollover if any of the following conditions are met:
- Either any primary shard reaches the size of 50GB,
- or any primary shard contains 200.000.000 documents,
- or the index reaches a certain age which depends on the retention time of your data stream,
- and has at least one document.
Remove Fields With an Ingest Pipeline
The data sent to Elasticsearch from the Home Assistant integration contains various fields we don’t need. We’re going to remove them in order to reduce long-term storage requirements and increase efficiency.
Elasticsearch allows you to run processing steps when ingesting data as part of a pipeline. The easiest processor to remove fields is Remove, but it cannot be used on fields with dots in their names (e.g., host.os.name) because it interprets dots as separators for nested objects. As an alternative, we’ll use the Script processor.
Create an Ingest Pipeline
In the left navigation bar, go to Management > Stack management > Ingest pipelines and click Create pipeline > New pipeline. Set the following pipeline properties:
- Name:
metrics-homeassistant - Description: Remove unnecessary fields in the Home Assistant data.
Click Add processor and set the following properties:
Processor:
Script(docs)Source:
for (def field : params.fields_to_remove) {ctx.remove(field);}Parameters:
{"fields_to_remove": ["agent.version", "event.action", "event.kind", "event.type", "host.architecture", "host.location", "host.os.name"]}Ignore failures for this processor: enable
Click Create pipeline.
Add the Ingest Pipeline to an Index Template
As with the replica configuration above, we can modify the settings for new indices via a component template. We’ll reuse the component template created earlier.
Navigate to Component templates > metrics-homeassistant@custom > edit and add the following setting for the component template:
- Index settings tab:
- Add:
"default_pipeline": "metrics-homeassistant"
- Add:
Add the Ingest Pipeline to Existing Indices
In the left navigation bar, go to Management > Dev tools. On the Console > Shell tabs, paste the following command:
GET .ds-metrics-homeassistant.*/_settings/
Press Ctrl + Enter to execute the command. The output window populates with the resulting settings for all Home Assistant indices. You’ll notice that the existing indices lack a setting default_pipeline.
To set the default pipeline for each Home Assistant index, execute the following command:
PUT .ds-metrics-homeassistant.*/_settings
{
  "index" : {
    "default_pipeline": "metrics-homeassistant"
  }
}
Inspect Pipeline Usage Statistics
Run the following command on the console to get usage statistics for the new pipeline:
GET _nodes/stats/ingest?filter_path=nodes.*.ingest.pipelines.metrics-homeassistant
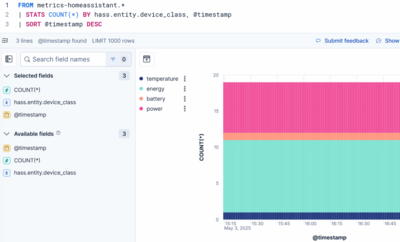
Inspect Raw Indexed Documents
To get the raw indexed documents, we need the _search API. ES|QL is designed for analytics and doesn’t provide such information.
Run the following command on the console:
GET /.ds-metrics-homeassistant.*/_search
{
  "query": {
    "range": {
      "@timestamp": {
        "gte": "now-15m",
        "lte": "now"
      }
    }
  }
}
The output includes the following fields:
_index: name of the index_id: document ID_score_source: raw document as indexed


Comments