Elasticsearch ES|QL: Energy Consumption Chart With Home Assistant Data
- Home Automation, Networking & Self-Hosting
- Published May 17, 2025 Updated Jun 26, 2025
Elasticsearch comes with multiple query languages, only one of which makes sense to use for time-series data as ours: ES|QL. It’s obviously modeled after Splunk’s SPL, is easy to read, understand, and write - helped by fantastic autocomplete in the web UI. This article explains some important ES|QL concepts by showing you how to create a chart that visualizes your home’s energy consumption.
Prerequisites
I’m assuming that you’ve set up Home Assistant and Elasticsearch as described in the previous articles on this site.
Getting Started With ES|QL
Elasticsearch’s “Splunk-alike” UI is called Discover. You’ll find it in the Observability section of the main menu. Once in Discover, click Try ES|QL in the upper right corner and you’re good to go.
Inspecting Our Data
Run the following query to better understand the type of data you already have via your Home Assistant integration:
FROM metrics-homeassistant.*
| STATS COUNT(*) BY hass.entity.id, hass.entity.friendly_name
| RENAME `COUNT(*)` AS count
The above search yields the number of events per Home Assistant entity ID and friendly name. It provides an overview of the HA entities you have data from in Elasticsearch.
Creating a Simple Energy Consumption Time Chart
My home’s power consumption is available via my solar inverter, a Fenecon (FEMS) device. The name of the corresponding Home Assistant sensor is sensor.fems_consumptionactivepower.
Querying for that HA sensor entity ID gives us a list of events where one event corresponds to a sensor measurement at a given point in time:
FROM metrics-homeassistant.*
| WHERE hass.entity.id == "sensor.fems_consumptionactivepower"
The returned events have fields as shown below:
{
  "@timestamp": "2025-04-25T22:33:10.175778Z",
  "data_stream.dataset": "homeassistant.sensor",
  "data_stream.namespace": "default",
  "data_stream.type": "metrics",
  "hass.entity.device_class": "power",
  "hass.entity.domain": "sensor",
  "hass.entity.friendly_name": "FEMS_ConsumptionActivePower",
  "hass.entity.id": "sensor.fems_consumptionactivepower",
  "hass.entity.name": "FEMS_ConsumptionActivePower",
  "hass.entity.object.id": "fems_consumptionactivepower",
  "hass.entity.platform": "modbus",
  "hass.entity.unit_of_measurement": "W",
  "hass.entity.value": "864.00",
  "hass.entity.value.keyword": "864.00",
  "hass.entity.valueas.float": 864,
  "host.hostname": "ha"
}
In the list of fields above, you’ll notice the time (@timestamp), the unit (hass.entity.unit_of_measurement, e.g., W for Watt), and the actual measured value (hass.entity.valueas.float).
To create a time chart, we only need to tell Elasticsearch how granular the results should be (bucket length) and how to compute the value for each bucket (typically, by averaging). That’s what we’re doing in the example below:
FROM metrics-homeassistant.*
| WHERE hass.entity.id == "sensor.fems_consumptionactivepower"
| STATS `Energy consumption` = AVG(hass.entity.valueas.float) BY Time = DATE_TRUNC(1 minute, TO_DATETIME(@timestamp))
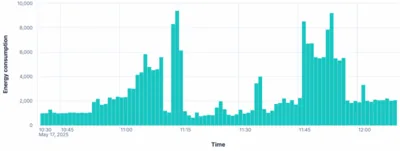
The above query gives us a nice time chart of the energy consumption in the selected search time range:
Creating a Stacked Time Chart With Multiple Data Series
Knowing the energy consumption of the entire home is a good starting point but we want to get more specific insights. Let’s create a chart that visualizes the energy consumption of my two major consumers, the heat pump and the wallbox, as well as the rest of the home.
The finished ES|QL search looks as follows:
FROM metrics-homeassistant.*
| EVAL Value_Watt = CASE(hass.entity.unit_of_measurement == "kW", hass.entity.valueas.float * 1000, hass.entity.valueas.float)
| STATS
   Heatpump = AVG(Value_Watt) WHERE hass.entity.id == "sensor.shelly_heatpump_total_active_power",
   Wallbox = AVG(Value_Watt) WHERE hass.entity.id == "sensor.easee_wallbox_leistung",
   Total = AVG(Value_Watt) WHERE hass.entity.id == "sensor.fems_consumptionactivepower"
   BY Time = DATE_TRUNC(5 minute, TO_DATETIME(@timestamp))
| EVAL Other = Total - Heatpump - Wallbox
| KEEP Heatpump, Wallbox, Other, Time
| LIMIT 10000
Explanation of the Search Query
Let’s take the above ES|QL search query apart and look at each pipeline element in turn.
FROM metrics-homeassistant.*
This is a source command that tells Elasticsearch to return a table with data from all data streams that match metrics-homeassistant.*.
| EVAL Value_Watt = CASE(hass.entity.unit_of_measurement == "kW", hass.entity.valueas.float * 1000, hass.entity.valueas.float)
EVAL is a processing command that adds a new field with a calculated value. We’re using it to convert entity values in kW to values in W by multiplying them with 1,000. We’re making use of CASE, one of ES|QL’s conditional functions.
| STATS
   Heatpump = AVG(Value_Watt) WHERE hass.entity.id == "sensor.shelly_heatpump_total_active_power",
   Wallbox = AVG(Value_Watt) WHERE hass.entity.id == "sensor.easee_wallbox_leistung",
   Total = AVG(Value_Watt) WHERE hass.entity.id == "sensor.fems_consumptionactivepower"
   BY Time = DATE_TRUNC(5 minute, TO_DATETIME(@timestamp))
STATS is one of the most important commands. It calculates aggregate values, optionally grouped. We’re using it to create a time chart with three series: Heatpump, Wallbox, and Total. The interval length is specified as a time duration (5 minute).
| EVAL Other = Total - Heatpump - Wallbox
Since we want to display the series as a stacked chart, we cannot use the total power. Instead, we calculate the value for “everything else”, i.e., the power consumption not caused by the heat pump and the wallbox.
| KEEP Heatpump, Wallbox, Other, Time
KEEP limits the output to the specified fields. We’re not interested in the temporary field Total, for example.
| LIMIT 10000
Finally, LIMIT increases the default number of rows returned by the query from 1,000 to 10,000.
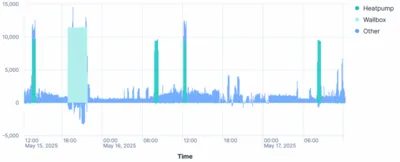
You may wonder about the negative values for Other while the wallbox is charging our car. I do, too. If you have an explanation, please be so kind and comment on this article.
You may also wonder why the heat pump is drawing so much power. That is a different story that is keeping several contractors quite busy.


Comments