Fixing VS Code UI Unresponsiveness Caused by GitHub Copilot Extension

Fixing VS Code UI Unresponsiveness Caused by GitHub Copilot Extension
This article shows a simple solution to a problem that doesn’t seem to be adequately documented: VS Code UI lags, freezes, and delays caused by the GitHub Copilot extension. 
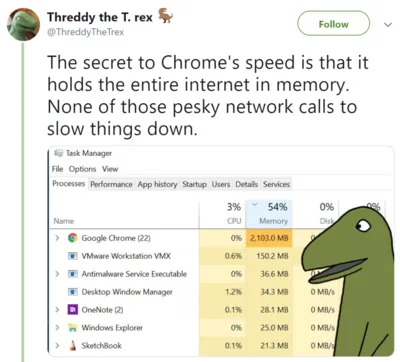
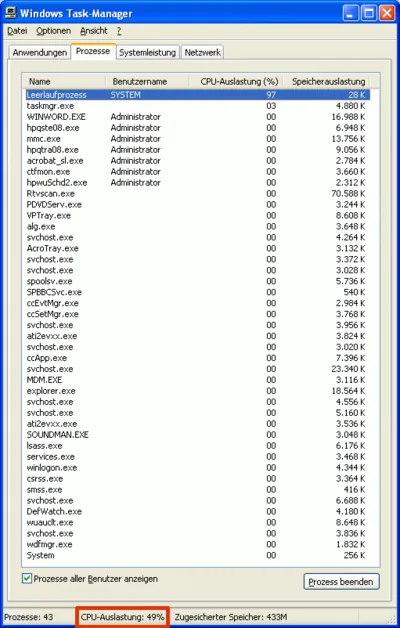
Problem: VS Code UI Becoming Slow Having worked on a Python project for a while, I noticed that VS Code’s UI was frequently freezing for seconds at a time. This was happening in various places of the UI: the editor itself but also in the GitHub Copilot Chat window. Copilot also seemed to be taking more and more time getting ready to answer, and the extension-host process would fully saturate one CPU core for long periods of time.
Applications

PowerShell Script: Test Chrome, Firefox & IE Browser Performance

PowerShell Script: Test Chrome, Firefox & IE Browser Performance
There is more than one way to test the performance of web browsers like Chrome, Firefox, or IE, but regardless of how you do it, you need a consistent workload that makes the browsers comparable. Unless you are testing with synthetic benchmarks (which come with a plethora of problems of their own) you need a way to automate browsers opening tabs and loading URLs. This article presents a simple solution to do just that.
Scripting

Why Sizing for Averages is a Bad Idea

Why Sizing for Averages is a Bad Idea
When sizing a new environment it is tempting to use averages. It seems the logical thing to do. But it also guarantees a bad user experience. Example: Sizing an RDS or XenApp Farm Let’s say you’re tasked with building a new Citrix XenApp farm. Being a diligent IT person you set up a pilot: one or two machines with all the right software and settings. Then you carefully select a group of pilot users in such a way that they represent the organization’s employee types statistically correctly. Then you let them work on the new platform, ironing out bugs and such. At the end of that period, you have a great new platform. But there is one big question left: how many servers to buy?!
Logs & Metrics

Impact of GPU Acceleration on Browser CPU Usage

Impact of GPU Acceleration on Browser CPU Usage
GPU acceleration is en vogue. After slowly but steadily moving out of the 3D niche it has arrived in the mainstream. Today, applications like Microsoft Office leverage the GPU, but even more so do web browsers. Chrome, Firefox, and Internet Explorer all have hardware acceleration turned on by default. People generally seem to be happy about that - GPUs are super-efficient, the more work they do the fewer remains for the CPU, overall energy consumption is reduced and battery life increases. Or so the myth goes. Interestingly, facts to prove that are hard to find. Nobody seems to have measured how GPU acceleration affects CPU usage. Let’s change that.
Performance/Sizing

How-to: XenApp/RDS Sizing and Capacity Planning with uberAgent for Splunk

How-to: XenApp/RDS Sizing and Capacity Planning with uberAgent for Splunk
Do you know the maximum number of users each of your terminal servers can host with acceptable performance? You may have found out the hard way how many are too many - but how many are just right? Farm sizing and server capacity planning are typical tasks for consultants who often have a hard time fighting the peculiarities of perfmon and logman trying to get the data they need for their calculations. It can be so much easier at no additional cost. The 60-day Enterprise Trial version of Splunk in conjunction with an evaluation license of uberAgent give all the information you need in much less time. Here is how.
Citrix/Terminal Services/Remote Desktop Services

Monitoring Browser Performance per Site with uberAgent for Splunk

Monitoring Browser Performance per Site with uberAgent for Splunk
The days are long gone when a browser was just another application. Modern websites are applications of their own, and the browser is their operating system. That has consequences for monitoring. It is no longer sufficient to gather performance data for the browser as a whole. When, for example, Internet Explorer’s CPU usage is high, Administrators need to understand what caused that. Is it the business-critical ERP site or are people just watching fun videos on YouTube?
Logs & Metrics

How to Reduce Bandwidth Usage and Optimize Website Performance with W3 Total Cache and Amazon CloudFront

How to Reduce Bandwidth Usage and Optimize Website Performance with W3 Total Cache and Amazon CloudFront
My website is hosted by Rochen, a company whose services I am very happy with. For reasons I understand they do not offer unlimited data transfer. My account, for example, comes with 50 GB per month. That is a lot and enough for most sites, including mine at this point in time. But I am selling software, and if a big news site writes about SetACL Studio the least of all things I want to happen is that Rochen suspends my account because the transfer limit has been reached.
Website

Solved: Firefox Freezes Every 10 Seconds, Scrolling is Jumpy

Solved: Firefox Freezes Every 10 Seconds, Scrolling is Jumpy
Problem Firefox (3.6.13) intermittently freezes. This happens during scrolling, text input, basically everywhere in the user interface, rendering the browser nearly useless. Analysis While browsing amazon.de I created a log of Firefox’s activities by recording system activity for 85 seconds with Sysinternals Process Monitor. I then filtered the log to include only Firefox activities. Clicking on Tools -> Process Activity Summary I got:
Performance/Sizing

How to Analyze Kernel Performance Bottlenecks (and Find that ATI's Catalyst Drivers Cause 50% CPU Utilization)

How to Analyze Kernel Performance Bottlenecks (and Find that ATI's Catalyst Drivers Cause 50% CPU Utilization)
Normally, finding the cause for high CPU utilization is easy - just start Task Manager. But what if the component consuming CPU cycles is a driver that runs in the kernel? In that case, there is no regular process Task Manager could attribute the usage to. You will see the “System Idle Process” at around 98%, but the “Performance” tab might indicate 50% CPU usage. How can that be?
Performance/Sizing

DiskLED - A Flexible Hard Disk and General System Activity Indicator System Tray Applet

DiskLED - A Flexible Hard Disk and General System Activity Indicator System Tray Applet
What do you do when your computer reacts sluggishly to even the simplest commands? You probably look at its hard disk LED to determine if the disk is busy, because if it is, the only thing that really helps is waiting (apart from buying a faster disk or SSD). Problem solved - if you are sitting right next to the machine. But what if you are using a protocol like RDP or ICA to connect to a remote computer or VM? No HDD LED, no quick and simple way to check for hard drive activity. This has been bugging me enough to write a software replacement: DiskLED.
Helge's Tools