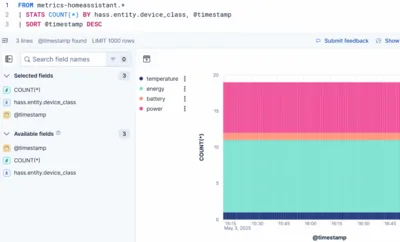
Elasticsearch ES|QL: Energy Consumption Chart With Home Assistant Data
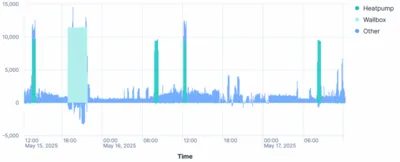
Elasticsearch comes with multiple query languages, only one of which makes sense to use for time-series data as ours: ES|QL. It’s obviously modeled after Splunk’s SPL, is easy to read, understand, and write - helped by fantastic autocomplete in the web UI. This article explains some important ES|QL concepts by showing you how to create a chart that visualizes your home’s energy consumption.
Home Automation, Networking & Self-Hosting