Monitoring any Application's Startup Duration with uberAgent 1.6
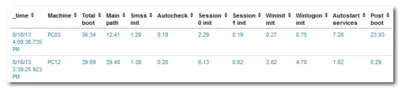
Application startup duration is an essential component of user experience. If you want to make sure that UX on your Windows machines is acceptable you need to monitor the time it takes for applications to start up. That, however, is not exactly easy - without uberAgent for Splunk.
uberAgent