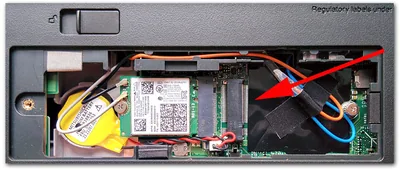
Customizing and Installing the Lenovo W540

Having made the switch from my trusty Lenovo T520 to the W540 here is my account of what works well and what does not. If you wonder what made me choose the W540: read this.
Hardware
| Tag 7 posts | |
| Windows General64-Bit Windows (X64)HardwarePerformance/SizingPhotographyWindows Internals |