Why Sizing for Averages is a Bad Idea

Why Sizing for Averages is a Bad Idea
When sizing a new environment it is tempting to use averages. It seems the logical thing to do. But it also guarantees a bad user experience. Example: Sizing an RDS or XenApp Farm Let’s say you’re tasked with building a new Citrix XenApp farm. Being a diligent IT person you set up a pilot: one or two machines with all the right software and settings. Then you carefully select a group of pilot users in such a way that they represent the organization’s employee types statistically correctly. Then you let them work on the new platform, ironing out bugs and such. At the end of that period, you have a great new platform. But there is one big question left: how many servers to buy?!
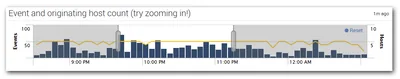
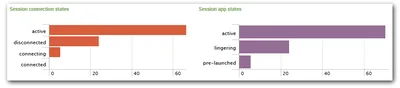
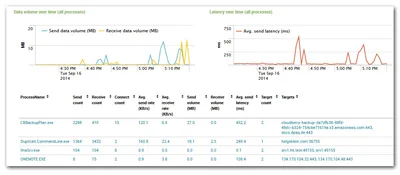
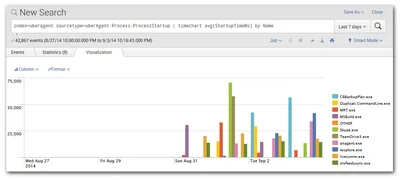
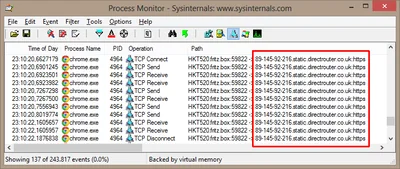
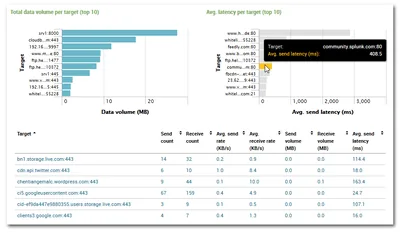
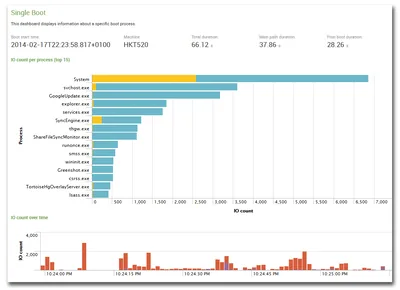
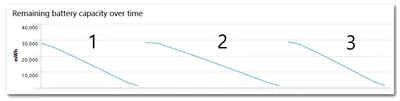
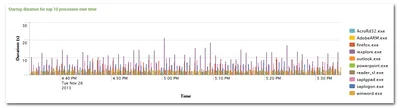
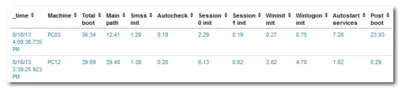
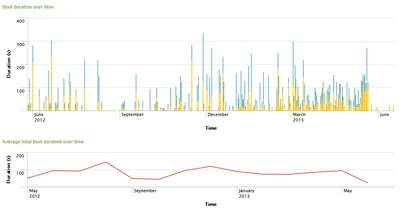
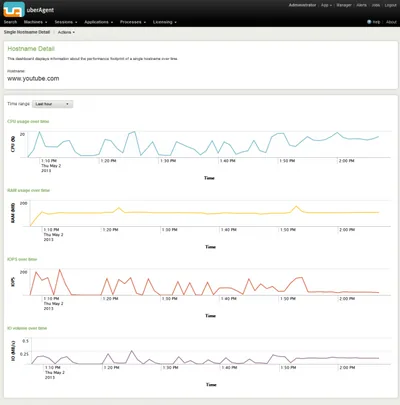
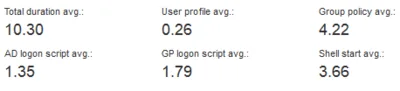
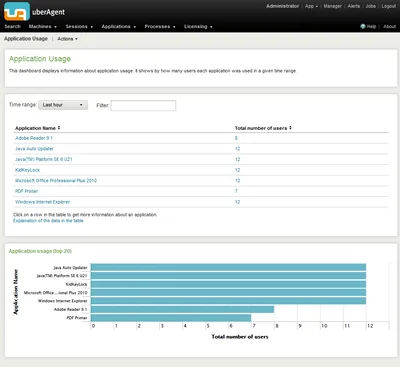
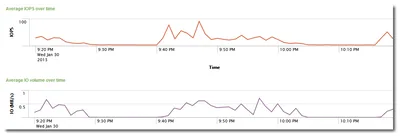
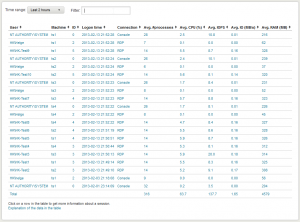
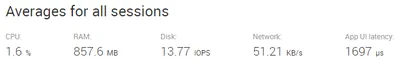
Logs & Metrics

Now you can PROVE that it's not Citrix but the backend!

Now you can PROVE that it's not Citrix but the backend!
You have been there: end-users are complaining and your boss demands an explanation why “Citrix is slow” - again. You, the XenApp/XenDesktop admin, desperately look at Task Manager and Perfmon, but you cannot find a thing. Your servers are humming along quite nicely, but still: applications are slow, the system feels sluggish and logons are taking forever. And then, all of a sudden, things are back to normal. What was going on? How do you prevent that from happening again?
Networking

Boot IO Analysis with uberAgent for Splunk 1.5

Boot IO Analysis with uberAgent for Splunk 1.5
Analyzing slow boots is a difficult task. You need to install software like XPerf and master its far-from-intuitive command-line options to generate a trace file that you can then analyze. Once you find a possible cause for the long startup duration you never know if it is specific to the machine you analyzed or if it affects other PCs, too. In other words: XPerf, although powerful, is difficult to master. And it does not scale. uberAgent does. And it is super-easy to use.
Logs & Metrics

How-to: XenApp/RDS Sizing and Capacity Planning with uberAgent for Splunk

How-to: XenApp/RDS Sizing and Capacity Planning with uberAgent for Splunk
Do you know the maximum number of users each of your terminal servers can host with acceptable performance? You may have found out the hard way how many are too many - but how many are just right? Farm sizing and server capacity planning are typical tasks for consultants who often have a hard time fighting the peculiarities of perfmon and logman trying to get the data they need for their calculations. It can be so much easier at no additional cost. The 60-day Enterprise Trial version of Splunk in conjunction with an evaluation license of uberAgent give all the information you need in much less time. Here is how.
Citrix/Terminal Services/Remote Desktop Services

Monitoring Browser Performance per Site with uberAgent for Splunk

Monitoring Browser Performance per Site with uberAgent for Splunk
The days are long gone when a browser was just another application. Modern websites are applications of their own, and the browser is their operating system. That has consequences for monitoring. It is no longer sufficient to gather performance data for the browser as a whole. When, for example, Internet Explorer’s CPU usage is high, Administrators need to understand what caused that. Is it the business-critical ERP site or are people just watching fun videos on YouTube?
Logs & Metrics

The Impossibility of Measuring IOPS (Correctly)

The Impossibility of Measuring IOPS (Correctly)
If you have ever used Sysinternals’ Process Monitor, chances are high you were a little intimidated when you looked at your first capture: it probably contained hundreds of thousands of registry and file system events, generated in a minute or less. That amount of activity must surely indicate high system load - but strangely, very often it does not. Looking at the hard disk LED you will only see an occasional flickering, even though thousands of file system events are captured per second. How is that possible? Read on to find out.
Performance/Sizing