Browser Video: Codecs, Formats & Hardware Acceleration
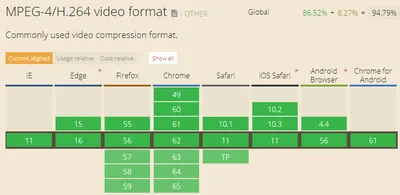
Web video is ubiquitous. We take it for granted that browsers play video in high resolution, over any connection, on any device. Behind the scenes, a complex machinery of video formats, codecs, and GPU acceleration techniques is at work to make it all happen. This post explains what is what.
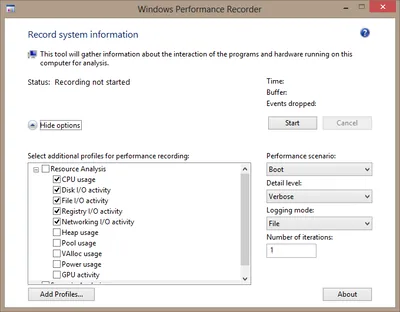
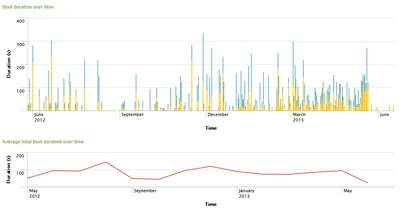
Performance/Sizing