LogQL: A Primer on Querying Loki from Grafana

This article introduces newbies to writing search queries in LogQL. It should help you get started with building Grafana dashboards based on log data in Loki. It would have helped me immensely building my first Grafana dashboard.
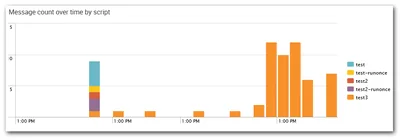
Logs & Metrics