How to Analyze Kernel Performance Bottlenecks (and Find that ATI's Catalyst Drivers Cause 50% CPU Utilization)
- Performance/Sizing
- Published Jan 4, 2010 Updated Oct 27, 2010
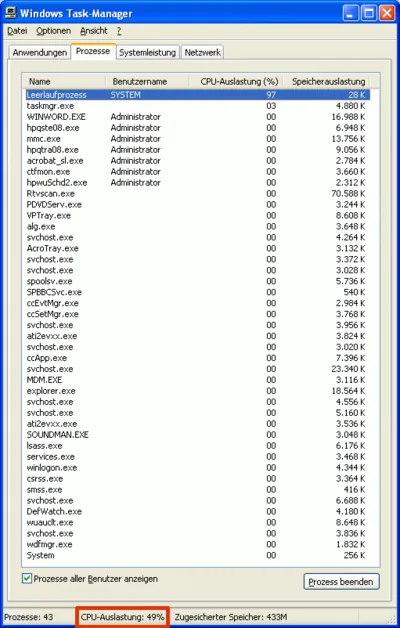
Normally, finding the cause for high CPU utilization is easy - just start Task Manager. But what if the component consuming CPU cycles is a driver that runs in the kernel? In that case, there is no regular process Task Manager could attribute the usage to. You will see the “System Idle Process” at around 98%, but the “Performance” tab might indicate 50% CPU usage. How can that be?
Problem
I recently had this exact scenario when I installed a new graphics card in a private PC. Here is how it looked in Task Manager:
Analysis
It looks like some kernel-mode component eats up CPU cycles. But which one? The tool of choice here is Microsoft’s Kernrate Viewer. It collects kernel-mode CPU performance data and later displays a summary of the most active modules (drivers). This is what I got:
C:\Programme\KrView\Kernrates>Kernrate_i386_XP.exe
 /==============================\

 \==============================/
Date: 2009/12/24   Time: 14:46:59
Machine Name: OTTOSPC
Number of Processors: 1
PROCESSOR_ARCHITECTURE: x86
PROCESSOR_LEVEL: 15
PROCESSOR_REVISION: 2f02
Physical Memory: 2047 MB
Pagefile Total: 2613 MB
Virtual Total: 2047 MB
PageFile1: \??\C:\pagefile.sys, 720MB
OS Version: 5.1 Build 2600 Service-Pack: 3.0
WinDir: C:\WINDOWS

Kernrate User-Specified Command Line:
Kernrate_i386_XP.exe


Kernel Profile (PID = 0): Source= Time,
Using Kernrate Default Rate of 25000 events/hit
Starting to collect profile data

***> Press ctrl-c to finish collecting profile data
===> Finished Collecting Data, Starting to Process Results

------------Overall Summary:--------------

P0     K 0:00:19.562 (59.4%)  U 0:00:00.078 ( 0.2%)  I 0:00:13.281 (40.3%)  DPC 0:00:00.000 ( 0.0%)  Interrupt 0:00:19.3
43 (58.8%)
       Interrupts= 14033581, Interrupt Rate= 426269/sec.


Total Profile Time = 32921 msec

                                       BytesStart          BytesStop         BytesDiff.
    Available Physical Memory   ,      1396867072,      1396502528,         -364544
    Available Pagefile(s)       ,      2206572544,      2206597120,           24576
    Available Virtual           ,      2132484096,      2131435520,        -1048576
    Available Extended Virtual  ,               0,               0,               0

                                  Total      Avg. Rate
    Context Switches     ,         8041,         244/sec.
    System Calls         ,        71045,         2158/sec.
    Page Faults          ,          447,         14/sec.
    I/O Read Operations  ,          195,         6/sec.
    I/O Write Operations ,           36,         1/sec.
    I/O Other Operations ,          972,         30/sec.
    I/O Read Bytes       ,        73962,         379/ I/O
    I/O Write Bytes      ,         8838,         246/ I/O
    I/O Other Bytes      ,        86695,         89/ I/O

-----------------------------

Results for Kernel Mode:
-----------------------------

OutputResults: KernelModuleCount = 132
Percentage in the following table is based on the Total Hits for the Kernel

Time   13125 hits, 25000 events per hit --------
 Module                                Hits   msec  %Total  Events/Sec
ati2mtag                               6477      32921    49 %     4918592
hal                                    6284      32921    47 %     4772030
ntkrnlpa                                196      32921     1 %      148841
VIDEOPRT                                 54      32921     0 %       41007
win32k                                   46      32921     0 %       34932
ati2dvag                                 27      32921     0 %       20503
ati3duag                                  8      32921     0 %        6075
ati2cqag                                  7      32921     0 %        5315
USBPORT                                   7      32921     0 %        5315
naveng                                    3      32921     0 %        2278
atikvmag                                  3      32921     0 %        2278
usbccgp                                   2      32921     0 %        1518
Ntfs                                      2      32921     0 %        1518
navex15                                   1      32921     0 %         759
watchdog                                  1      32921     0 %         759
SPBBCDrv                                  1      32921     0 %         759
SYMTDI                                    1      32921     0 %         759
SYMEVENT                                  1      32921     0 %         759
savrt                                     1      32921     0 %         759
usbehci                                   1      32921     0 %         759
CLASSPNP                                  1      32921     0 %         759
ACPI                                      1      32921     0 %         759

================================= END OF RUN ==================================
============================== NORMAL END OF RUN ==============================
It looks like the module “ati2mtag” consumed most CPU cycles.
Resolution
A quick web search later I had the solution: ATIs catalyst drivers seem to have a problem in certain scenarios that is related to HD audio. Disabling “Microsoft UAA Bus Driver for High Definition Audio” in Device Manager fixed this issue for me.
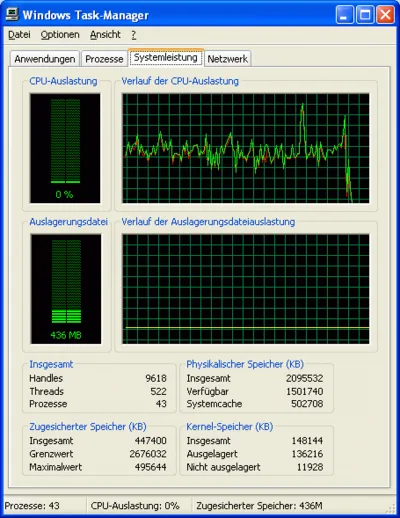
Here is a screen shot from Task Manager right after disabling said audio driver:


Comments