Auditing Samba File & Directory Changes With Elasticsearch
- Home Automation, Networking & Self-Hosting
- Published Jul 18, 2026
This article explains how to set up an auditing (change-tracking) system for Samba file shares that shows who created, deleted, or changed a file or directory and when. The solution is optimized for security, high performance, and low maintenance.
This article is part of a mini-series about running Samba Active Directory and a file server service in a Docker container on a home server:
- Samba Active Directory in a Docker Container: Installation Guide
- Samba Active Directory as Authelia’s Authentication Backend
- Samba File Server With Windows ACLs in a Docker Container
- Samba File Server With POSIX ACLs in a Docker Container
- Web Access Through Filebrowser With SSO & HTTPS
- Web Access Through Filestash With Passthrough Auth
- Web Access Through Sambee With Automatic HTTPS
- Auditing Samba File & Directory Changes With Elasticsearch (this article)
- GitHub repository with Docker files and helper scripts

Architecture Overview
We extend the Docker Compose configuration by adding a Filebeat container to the existing Samba domain controller and file server containers.
We add the auditing VFS module to the Samba file server and configure it to write audit log messages to syslog, redirected to a socket that is shared between the file server and Filebeat containers.
We configure Filebeat to read the socket, parse the syslog envelope, drop non-audit events, and forward the remaining messages to an Elasticsearch data stream. An ingest pipeline in Elasticsearch then parses Samba’s audit payload into structured fields.
Preparation
I’m assuming that you’ve set up Docker, the Caddy container, a Samba file server, and an Elasticsearch machine as described in previous articles.
Dockerized Samba Directory Structure
We’re adding or changing the following in the existing directory structure:
rpool/
 └── encrypted/
     └── docker/
         └── samba/
             ├── config-filebeat/
                 └── filebeat.yml
             ├── data-filebeat/
             ├── data-shared/
             	  └── audit-logs/
             ├── .env
             └── docker-compose.yml
Create Directories
Create the new directories and change ownership of the shared directories to UID/GID 1000, which the Filebeat container uses:
mkdir -p /rpool/encrypted/docker/samba/config-filebeat
mkdir -p /rpool/encrypted/docker/samba/data-filebeat
mkdir -p /rpool/encrypted/docker/samba/data-shared/audit-logs
chown -Rfv 1000:1000 /rpool/encrypted/docker/samba/data-filebeat
chown -Rfv 1000:1000 /rpool/encrypted/docker/samba/data-shared/audit-logs
Enable Samba Auditing
We’re configuring Samba’s auditing module to write to syslog via /dev/log, which we redirect to a shared socket that the Filebeat container reads from. Note that this doesn’t isolate audit traffic. Filebeat parses the syslog envelope and drops any messages that aren’t audit events.
Which Operations to Monitor
Samba’s full_audit VFS module adds thin wrappers around SMB operations. This provides insights into what applications are trying to do, but not necessarily what is actually happening.
File creation is a perfect example. Tracking each newly created file may sound like a simple and natural requirement, but Samba’s auditing can’t answer it reliably at the time of writing. Applications can ask the operating system to open a file if it exists and create it otherwise. The operating system checks whether the file exists, optionally creates it, and returns a handle to the new or existing file. Although Samba’s auditing module receives information about whether a new file was created, it doesn’t expose that crucial result in the audit log.
Because new-file creation and overwrites can’t be detected reliably, we restrict the list of monitored events to:
- Directory creation
- Directory/file rename
- Directory/file delete
Docker Compose File
Add the following to docker-compose.yaml:
services:
  fs1:
    # Micro-entrypoint: symlink /dev/log to the shared socket, then replace the shell with tini (PID 1)
    entrypoint: >
      /bin/sh -c "
      ln -sf /var/log/samba-audit/syslog.sock /dev/log &&
      exec /bin/tini -- /usr/helpers/init-fs.sh
      "
    volumes:
      # Shared socket directory
      - ./data-shared/audit-logs:/var/log/samba-audit
Samba Configuration
Add the following to your file server Samba configuration file config-fs1/samba/smb.conf:
[your-share]
	# VFS modules (make sure to include all modules - this is not cumulative to a global definition but replaces it instead)
	# If you also use recycle bin, combine both objects in a single line.
	# Make sure to stack modules so that full_audit comes first and sees what the client requested (before recycle moves deleted files to the bin):
	# vfs objects = full_audit recycle
	vfs objects = full_audit

	# Prefix format: Username|Client IP|Share Name
	full_audit:prefix = %u|%I|%S

	# Only track structural lifecycle changes to prevent log flooding
	# mkdirat:  directory create
	# renameat: directory/file rename
	# unlinkat: directory/file delete
	full_audit:success = mkdirat renameat unlinkat

	# Send audit logs over syslog (/dev/log)
	full_audit:syslog = true
	full_audit:facility = LOCAL5
	full_audit:priority = NOTICE
Recreate the File Server Container
Navigate into the directory with docker-compose.yml and run:
docker compose down
docker compose up -d
Inspect Audit Log Messages
If you want to inspect the generated audit log messages, make the following (temporary) changes to config-fs1/samba/smb.conf:
[global]
	log level = 1

[your-share]
  full_audit:syslog = false
After the change, restart fs1 and inspect the Docker logs:
docker compose restart fs1
docker compose logs --tail 50
Elasticsearch
Internal Network
We’re adding a Docker-internal network for other containers to talk to the existing Elasticsearch instance, bypassing the authenticating proxy.
Add the following to Elasticsearch’s docker-compose.yaml:
services:
  elasticsearch:
    networks:
      - caddynet
      - elasticnet

networks:

  elasticnet:
    name: elasticnet
    attachable: true
    driver: bridge
    driver_opts:
      com.docker.network.bridge.name: docker_elastic
    ipam:
      driver: default
      config:
        - subnet: 172.30.0.0/16
Data Format
When full_audit:syslog = true, Samba sends syslog messages with the program name smbd_audit. The message payload uses this fixed format:
PREFIX|OPERATION|RESULT|FILE
Because we configured full_audit:prefix = %u|%I|%S, the payload after syslog parsing looks like this:
username|client-ip|share-name|operation|result|path
Example:
AD\helge|10.0.9.123|Data|mkdirat|ok|/srv/samba/data/Helge/Temp/Test 2
AD\helge|10.0.9.123|Data|unlinkat|ok|/srv/samba/data/Helge/Temp/Test 2
Ingest Pipeline
Create the ingest pipeline referenced by Filebeat. It parses the Samba payload, trims the trailing newline from file.path, and removes transport metadata that is no longer needed after filtering.
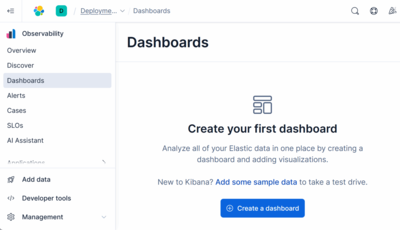
In Kibana (Elasticsearch’s web UI), navigate to Dev Tools > Console and paste the following request:
PUT /_ingest/pipeline/samba-socket-pipeline
{
  "description": "Parse Samba full_audit messages and keep only storage-relevant fields",
  "processors": [
    {
      "dissect": {
        "field": "message",
        "pattern": "%{samba.audit.user}|%{source.ip}|%{samba.audit.share}|%{samba.audit.operation}|%{samba.audit.result}|%{file.path}"
      }
    },
    {
      "trim": {
        "field": "file.path"
      }
    },
    {
      "remove": {
        "field": [
          "message",
          "agent",
          "ecs",
          "host",
          "input",
          "log",
          "samba.audit.result"
        ],
        "ignore_missing": true
      }
    }
  ]
}
Press Ctrl+Enter to execute the request.
Data Stream and Retention
To keep the setup minimal, we use a data stream lifecycle with built-in retention instead of a more verbose ILM policy. Because the Elasticsearch setup used here has only a single data node, we also set number_of_replicas to 0 to avoid a yellow cluster health state.
Create an index template for the samba-audit data stream that defines the event schema and specifies the data_retention:
PUT /_index_template/samba-audit
{
  "index_patterns": ["samba-audit"],
  "data_stream": {},
  "priority": 500,
  "template": {
    "settings": {
      "number_of_replicas": 0,
      "codec": "best_compression"
    },
    "mappings": {
      "dynamic": false,
      "properties": {
        "@timestamp": {
          "type": "date"
        },
        "file": {
          "properties": {
            "path": {
              "type": "keyword",
              "ignore_above": 4096
            }
          }
        },
        "source": {
          "properties": {
            "ip": {
              "type": "ip"
            }
          }
        },
        "samba": {
          "properties": {
            "audit": {
              "properties": {
                "operation": {
                  "type": "keyword"
                },
                "share": {
                  "type": "keyword",
                  "ignore_above": 256
                },
                "user": {
                  "type": "keyword",
                  "ignore_above": 256
                }
              }
            }
          }
        }
      }
    },
    "lifecycle": {
      "data_retention": "180d"
    }
  },
  "_meta": {
    "description": "Data stream template for Samba audit logs"
  }
}
Create the data stream explicitly:
PUT /_data_stream/samba-audit
You can verify that retention is active with:
GET /_data_stream/samba-audit/_lifecycle
Filebeat
Configuration
We’re configuring Filebeat with a Unix socket input plus a syslog processor. An additional drop_event processor instructs Filebeat to ignore events that don’t originate from Samba’s audit module.
Filebeat then forwards the remaining events to our Elasticsearch instance.
Notes:
- We’ve set up Elasticsearch without authentication, protecting it at the reverse proxy instead.
- Filebeat talks to Elasticsearch via Docker-internal networking, bypassing the reverse proxy.
- Samba audit messages show up with the label
smbd_audit:, which Filebeat stores in the fieldlog.syslog.hostname.
Add the following to the Filebeat configuration file config-filebeat/filebeat.yml:
filebeat.inputs:
  - type: unix
    path: "/var/log/samba-audit/syslog.sock"
    socket_type: datagram
    mode: "0666"
    processors:
      - syslog:
          field: message
          format: rfc3164
      - drop_event:
          when:
            not:
              and:
                - equals:
                    log.syslog.hostname: "smbd_audit:"
                - equals:
                    log.syslog.facility.code: 21
                - equals:
                    log.syslog.severity.code: 5
    pipeline: "samba-socket-pipeline"

output.elasticsearch:
  hosts: ["http://elastic1:9200"]
  index: "samba-audit"
  preset: balanced

setup.template.enabled: false
Docker Compose File
We’re setting up a Filebeat service in the same Docker Compose file as the fs1 file server. Because Filebeat creates the shared socket, we add a dependency so that fs1 waits until Filebeat’s socket listener is healthy before starting.
Add the following Filebeat service configuration to docker-compose.yaml:
services:

  fs1:
    depends_on:
      dc1:
        condition: service_started
      filebeat:
        condition: service_healthy
        restart: true

  filebeat:
    container_name: filebeat
    hostname: filebeat
    image: docker.elastic.co/beats/filebeat:9.4.3
    restart: unless-stopped
    networks:
      - elasticnet
    user: 1000:1000
    healthcheck:
      test: ["CMD-SHELL", "test -S /var/log/samba-audit/syslog.sock"]
      interval: 5s
      timeout: 3s
      retries: 12
      start_period: 5s
    volumes:
      - /etc/localtime:/etc/localtime:ro
      - ./data-shared/audit-logs:/var/log/samba-audit
      - ./config-filebeat/filebeat.yml:/usr/share/filebeat/filebeat.yml:ro
      - ./data-filebeat:/usr/share/filebeat/data

networks:
  elasticnet:
    external: true
Container Creation
Navigate into the directory with docker-compose.yml and run:
docker compose up -d
Verification
To verify that auditing works, create or delete a directory. Then run the following ES|QL query in Kibana’s Discover mode (details):
from samba-audit
You should see one event per monitored file system operation similar to the following (line breaks added for readability):
@timestamp Jul 18, 2026 @ 00:17:26.000
file.path /srv/samba/data/Helge/Temp/Test 24
samba.audit.operation mkdirat
samba.audit.share Data
samba.audit.user AD\helge
source.ip 10.1.2.3
Event Data Format
Each Samba auditing event has the following fields:
| Field | Description |
|---|---|
@timestamp | Timestamp of the syslog message generated by Samba |
file.path | Path of the modified file/directory Local to the file server (not UNC paths) In case of renames: OLD_PATH|NEW_PATH |
samba.audit.operation | mkdirat: directory createrenameat: directory/file renameunlinkat: directory/file delete |
samba.audit.share | Name of the file share |
samba.audit.user | Name of the Samba user in the format domain\user |
source.ip | IP address of the SMB client |
Conclusion
That’s it: we’re now tracking file and directory creation, rename/move, and deletion operations. The only thing left is a report that compiles recent changes in a readable format. That’s a topic for another post.




Comments