Now you can PROVE that it’s not Citrix but the backend!
You have been there: end-users are complaining and your boss demands an explanation why “Citrix is slow” – again. You, the XenApp/XenDesktop admin, desperately look at Task Manager and Perfmon, but you cannot find a thing. Your servers are humming along quite nicely, but still: applications are slow, the system feels sluggish and logons are taking forever. And then, all of a sudden, things are back to normal. What was going on? How do you prevent that from happening again?
The reason for these mystery events very often lies with a backend service experiencing problems or hitting a bottleneck. If, for example, the file server is under high load, its response times are going to increase and your users will notice. Now all you need is a tool to prove that:
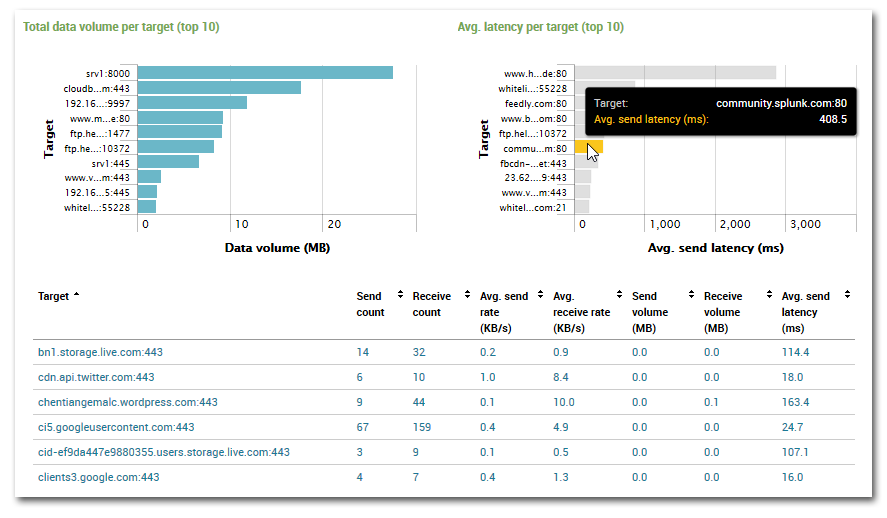
Beginning with version 1.9.5 uberAgent reports on network performance – individually per communication target. It shows you the data volume transferred and, much more importantly, the latency of the connection. Looking at the latency over time it is trivial to spot whether a particular service is currently performing subpar or not:
![]()