How-to: XenApp/RDS Sizing and Capacity Planning with uberAgent for Splunk
Do you know the maximum number of users each of your terminal servers can host with acceptable performance? You may have found out the hard way how many are too many – but how many are just right? Farm sizing and server capacity planning are typical tasks for consultants who often have a hard time fighting the peculiarities of perfmon and logman trying to get the data they need for their calculations. It can be so much easier at no additional cost. The 60-day Enterprise Trial version of Splunk in conjunction with an evaluation license of uberAgent give all the information you need in much less time. Here is how.
The Procedure
The Trial version of Splunk allows you to index 500 MB per day. That is enough to have uberAgent collect data from at least six XenApp or RDS servers. Six servers is a large enough number to make the data statistically relevant in most environments.
Here is what we will do to calculate the total capacity in terms of users per server:
- Install Splunk
- Install uberAgent on six XenApp/RDS servers
- Confirm things are working
- Wait two weeks while data is collected
- Transfer the data to an analysis machine
- Analyze
- Write a report
The following sections explain each of these steps in detail.
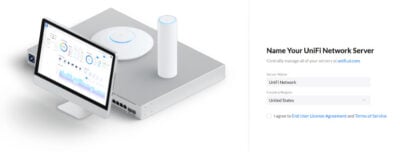
Installing Splunk
Although installing Splunk is simple and straightforward, be sure to follow our instructions closely. When choosing a server for Splunk keep in mind that it needs enough hard disk capacity to store 14 x 500 MB x compression = around 1 GB. By default, Splunk stores its data where you install it so the easiest way to have Splunk store data on a partition different than C: is to install Splunk where you want the data to be.
If you create a virtual machine for Splunk configure at least 2 vCPUs and 8 GB RAM – of course, more is always better. In this case, it will make the searches run faster.
All in all, it should not take longer than 30 minutes to install Splunk.
Installing uberAgent
Following our instructions you should have uberAgent up and running in no time. Please note that if you use PVS or another imaging method you need to prepare Splunk’s Universal Forwarder for that. Details are in the instructions.
After installation uberAgent will display a splash screen during logon as an enticement to get a license. Contact us, we are happy to provide time-limited evaluation licenses.
Check the Installation
Once everything is installed log on to Splunk and navigate to the uberAgent app using the menu in the upper right corner:
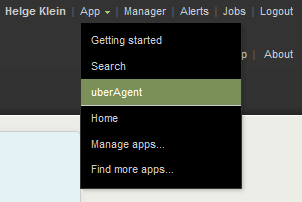
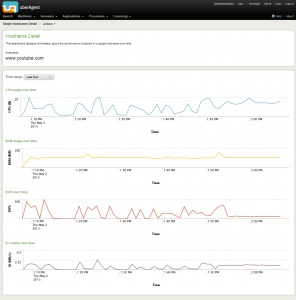
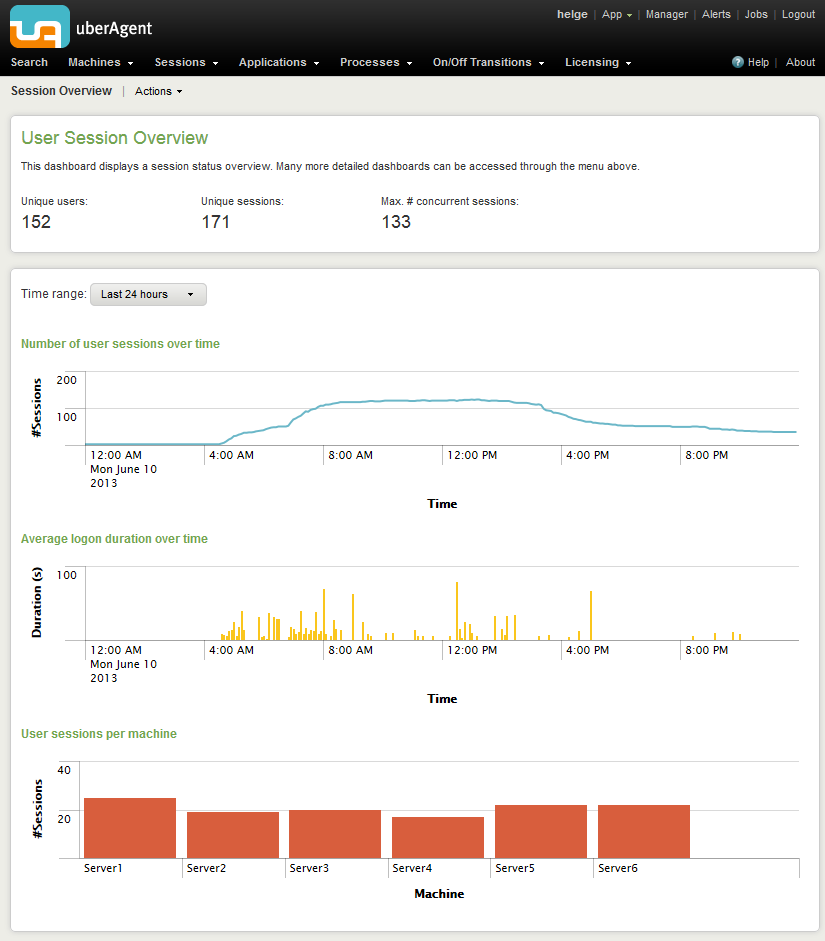
You will see an empty User Session Overview dashboard. Empty because no data has been collected yet, of course. Do not worry, it will be much more beautiful later, e.g. like this:
Log on with a test user to one of the monitored servers. Wait one minute and then refresh the dashboard. You should now see some data.
Use uberAgent’s menu to nativgate to the Machine Detail dashboard:
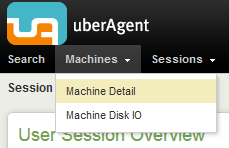
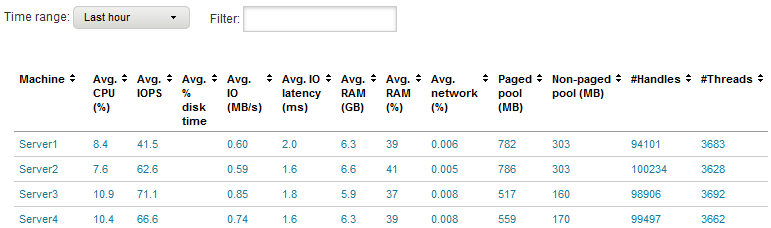
Make sure you get data from each of your servers. It should look similar to this:
Now wait.
Wait
There is not much to say about this except that you probably should not pick the holiday season for your data collection. You want two typical weeks.
Transferring the Collected Data to an Analysis Machine
Depending on your situation it may be feasible to analyze the data using the customer’s Splunk installation. You are more flexible, though, if you transfer it to a different analysis machine which can be off-premises. A typical consultant’s laptop would be suitable. You need to ask permission, of course.
To copy the index to another machine:
- Install Splunk on the analysis machine
- Stop the
splunkdservice on the source and target machines - Copy
C:\Program Files\Splunk\var\lib\splunk\uberagentto the analysis machine (same location) - Start Splunk on analysis machine
- Tell Splunk about the new index by installing the uberAgent app on the analysis machine (
uberAgent.tar.gz)
Analyzing the Collected Data
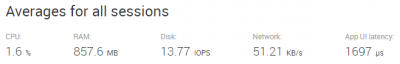
Session
Use the dashboard Session Overview to determine per-session values. It shows you the maximum number of concurrent sessions:
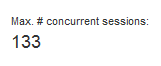
Given that we monitored six servers the average maximum number of sessions per server is: 133 / 6 = 23
This value is, just like all the other values calculated here, rounded – to be on the safe side.
CPU
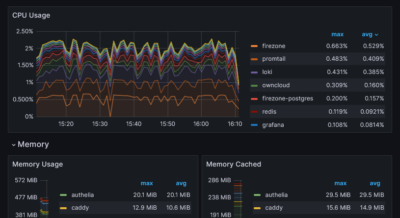
Use the dashboard Session 0 to find the CPU usage of all system services combined. In this example let us assume it is 4%.
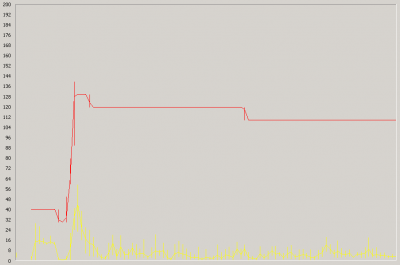
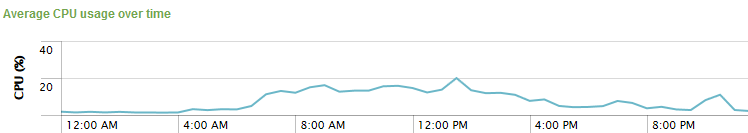
Use the dashboard Machine Detail to determine the maximum CPU usage, 20% in this example:
Calculate the maximum CPU usage per session: (20% – 4%) / 23 sessions = 0.7% / session
Calculate the server capacity by CPU only: (100% – 4%) / 0.7% / session = 137 sessions
RAM
Use the dashboard Session 0 to find the RAM usage of all system services combined. In this example let us assume it is 1,500 MB.
Use the dashboard Machine Detail to determine the maximum RAM usage, 60% in this example:
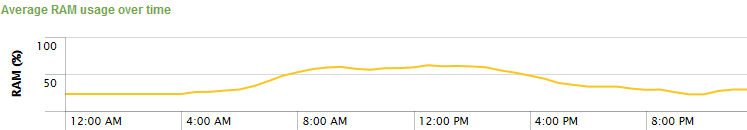
Calculate the maximum absolute RAM usage (assuming 24 GB installed): 24,576 MB * 60% = 14,746 MB
Calculate the maximum absolute RAM used for user sessions: 14,746 MB – 1,500 MB = 13,246 MB
Calculate the maximum RAM usage per session: 13,246 MB / 23 sessions = 576 MB / session
Calculate the server capacity by RAM only: (24,576 MB – 1,500 MB) / 576 MB / session = 40 sessions
Disk
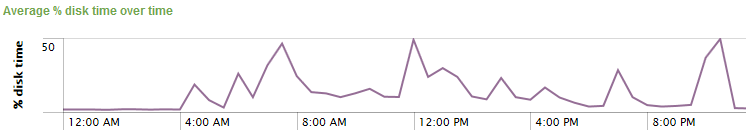
Use the dashboard Machine Disk IO to determine the maximum hard disk usage, 50% in this example:
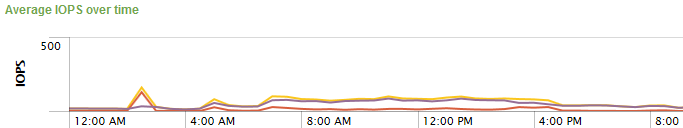
You may also want to take a look at IOPS:
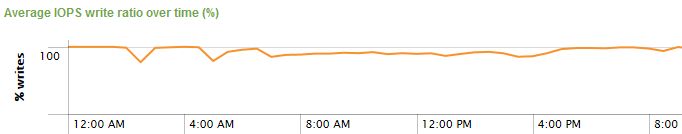
Write ratio (how many of the IOPS are writes):
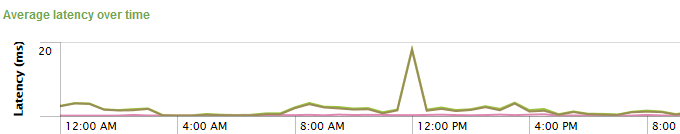
Latency (how long does it take for an IO to be processed):
Calculate the maximum disk usage per session: 50% / 23 sessions = 2.2% / session
Calculate the server capacity by disk only: 100% / 2.2% / session = 45 sessions
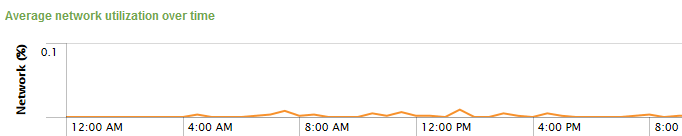
Network
The network utilization of XenApp/RDS servers is typically so small that it can be neglected:
Summary
Looking at the CPU only, each server supports 137 sessions. Looking at RAM only that number drops to 40. For the disk, it is 45. Obviously, these servers have too much CPU capacity. They are limited by RAM and disk equally. It might make sense to increase the RAM a little bit. Increasing the hard disk performance in terms of IOPS is typically not easily possible.
Writing the Capacity Report
I will leave this to you.
Get to Work!
Go do your own capacity reports!